
The undocumented Lighthouse guide
Lighthouse is the go-to tool for improving the quality of web pages. Lately, I have been using Lighthouse a lot at work ↗︎ to identify opportunities for performance optimizations. This post is part of a 6 part series that I have written about how to get the most out of Lighthouse.

Quick Lighthouse intro
Lighthouse is an open-source automated tool for auditing the quality of web pages. This tool generates scores for performance, accessibility, progressive web apps, SEO, and best practices of a specific URL. Lighthouse also offers recommendations on how to improve the inefficient items of the audits.
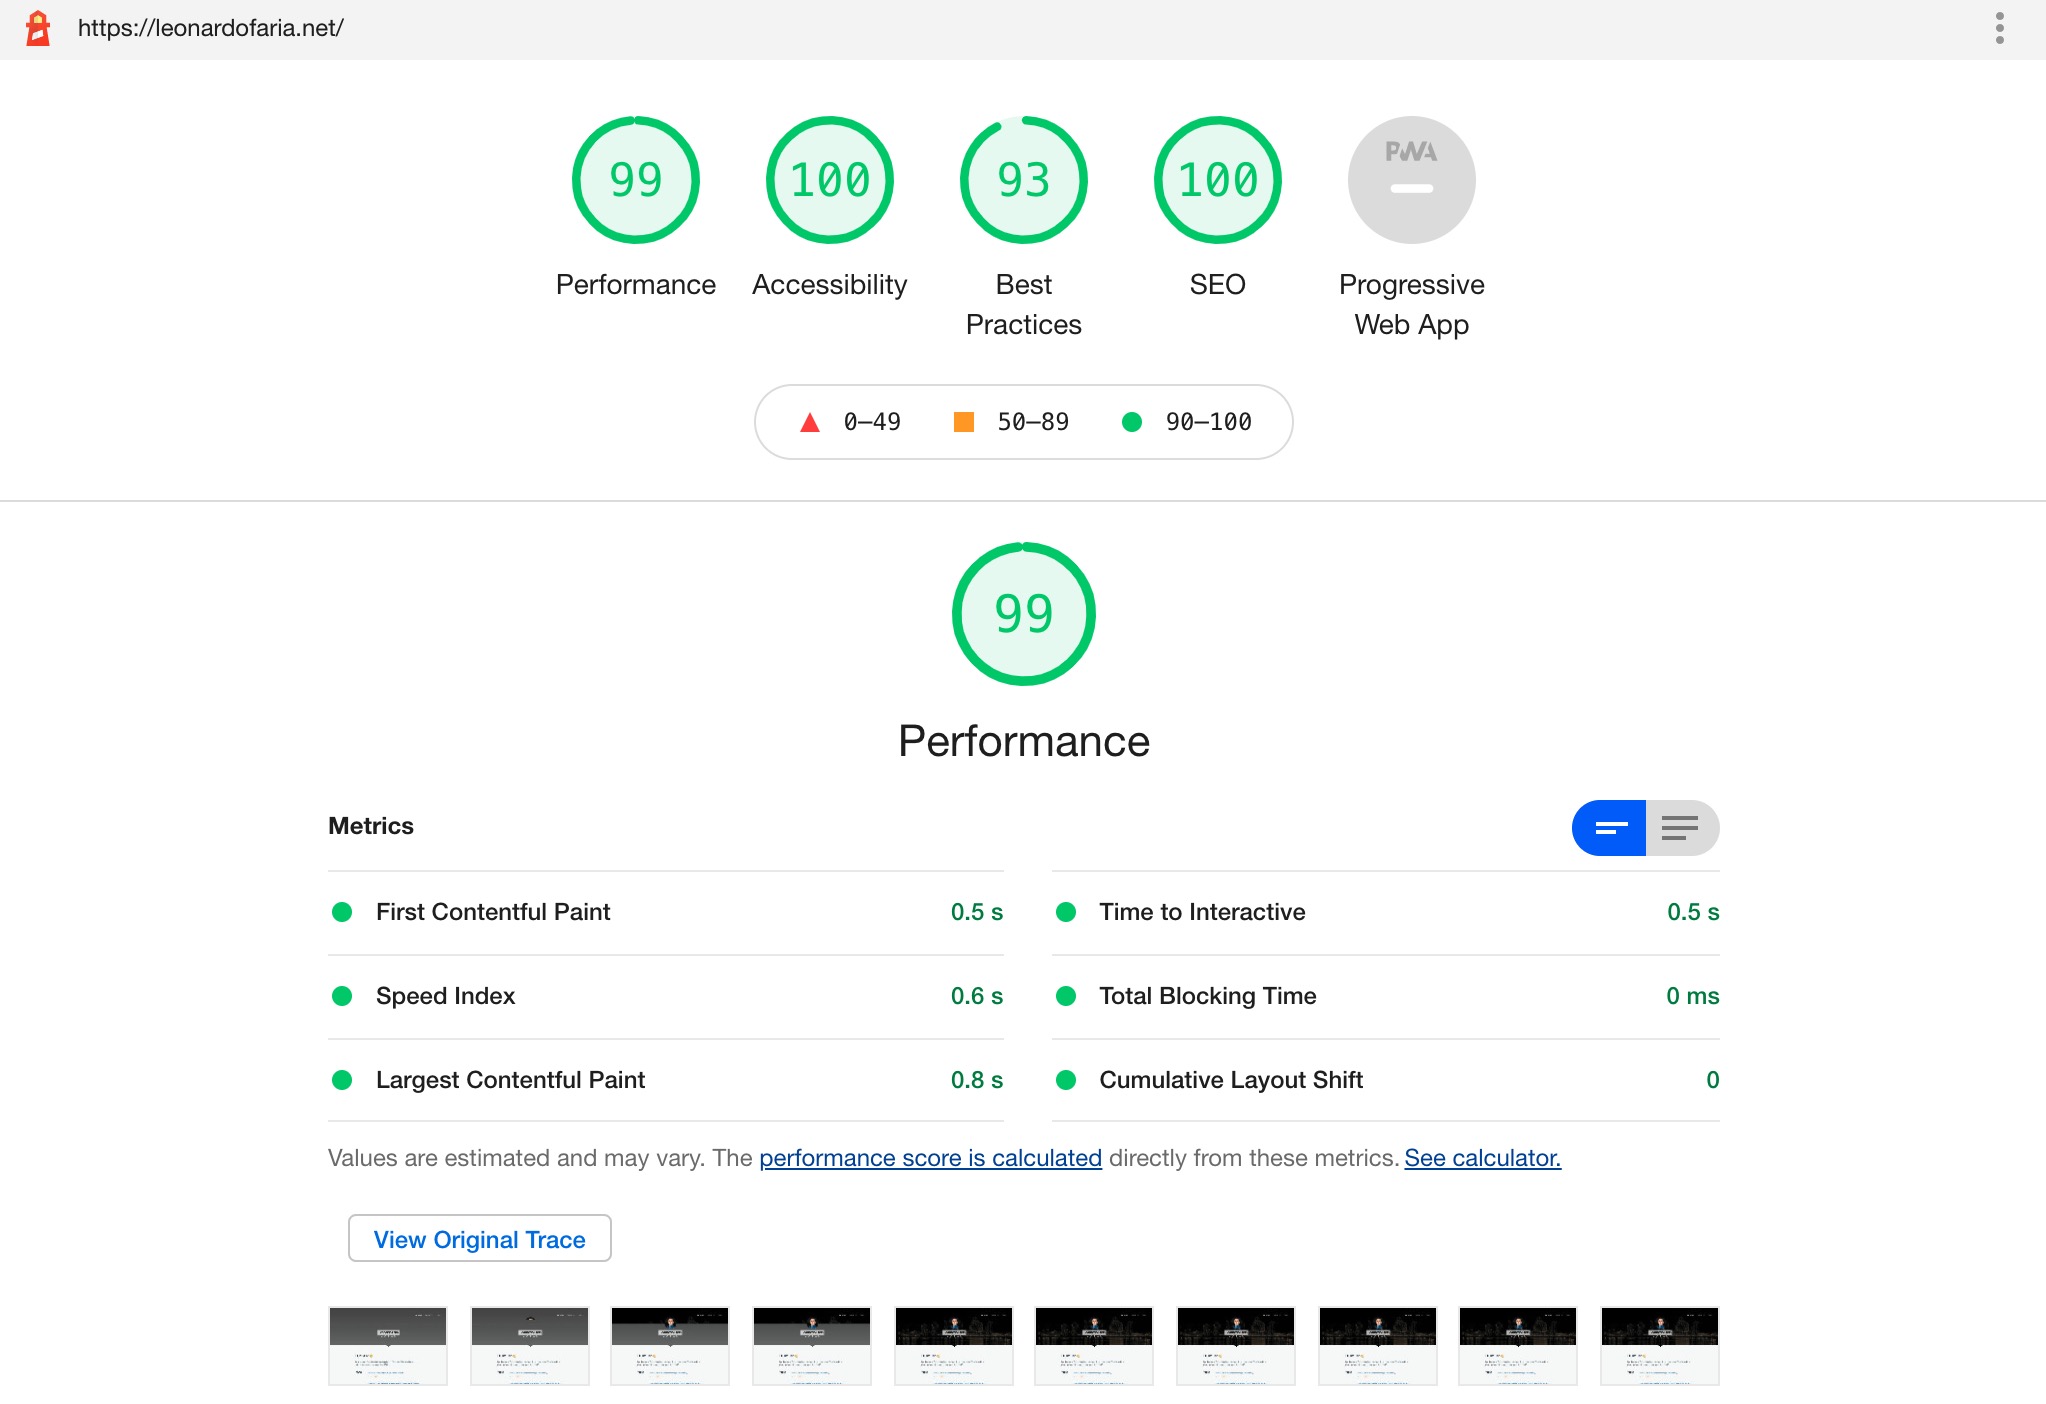
The recommendations offered by Lighthouse are invaluable in helping to clarify what can be done to improve the quality of a page or web app. Based on their recommendations, developers can inform Product Managers, as well as other stakeholders, and prioritize the most important/impactful tasks from there.
There are different ways to run Lighthouse audits:
- From a web UI: Run Lighthouse via PageSpeed Insights
- In Chrome DevTools: Open the tab Audit in the Chrome DevTools - a quick way to audit pages behind authentication
- From the command line: Install the
lighthouseCLI and start testing - As a Node module: Add the
lighthousemodule in Node scripts
This series of posts will cover the usage of Lighthouse as a Node module. At my workplsvr, I have created a JavaScript tool which runs every hour to programmatically audit 9 critical parts of our applications. The results are stored in a Postgres database and in Prometheus (a monitoring system & time-series database) so we can follow the reports over time.
The Lighthouse Node package
The Lighthouse docs present a basic example of how to start our journey. Please see below:
const fs = require('fs');
const lighthouse = require('lighthouse');
const chromeLauncher = require('chrome-launcher');

(async () => {
  const chrome = await chromeLauncher.launch({chromeFlags: ['--headless']});
  const options = {logLevel: 'info', output: 'html', onlyCategories: ['performance'], port: chrome.port};
  const runnerResult = await lighthouse('https://example.com', options);

  // `.report` is the HTML report as a string
  const reportHtml = runnerResult.report;
  fs.writeFileSync('lhreport.html', reportHtml);

  // `.lhr` is the Lighthouse Result as a JS object
  console.log('Report is done for', runnerResult.lhr.finalUrl);
  console.log('Performance score was', runnerResult.lhr.categories.performance.score * 100);

  await chrome.kill();
})();
The first 3 lines import required packages: fs for file system manipulation; lighthouse, the main audit package; and chrome-launcher, a package used for launching Chrome. Lighthouse needs to know which port has a Chrome instance running, so this audit can happen.
Line 7 surfaces a few Lighthouse options, like logLevel (silent | error | info |verbose), output (json | html | csv) and onlyCategories (an array filtering the tests you want to run). Their type definitions file showcase all the offered options.
Next, the test is stored in the runnerResult variable (line 8). The runnerResult is an object that contains an HTML report, which is stored in the disk (lines 11-12). This result object is the main topic of my next few posts. There we will learn how to get relevant information from the audits.
Afterwards, the terminal will show the tested URL and its performance score (lines 15-16) and lastly, the Chrome instance will be closed.
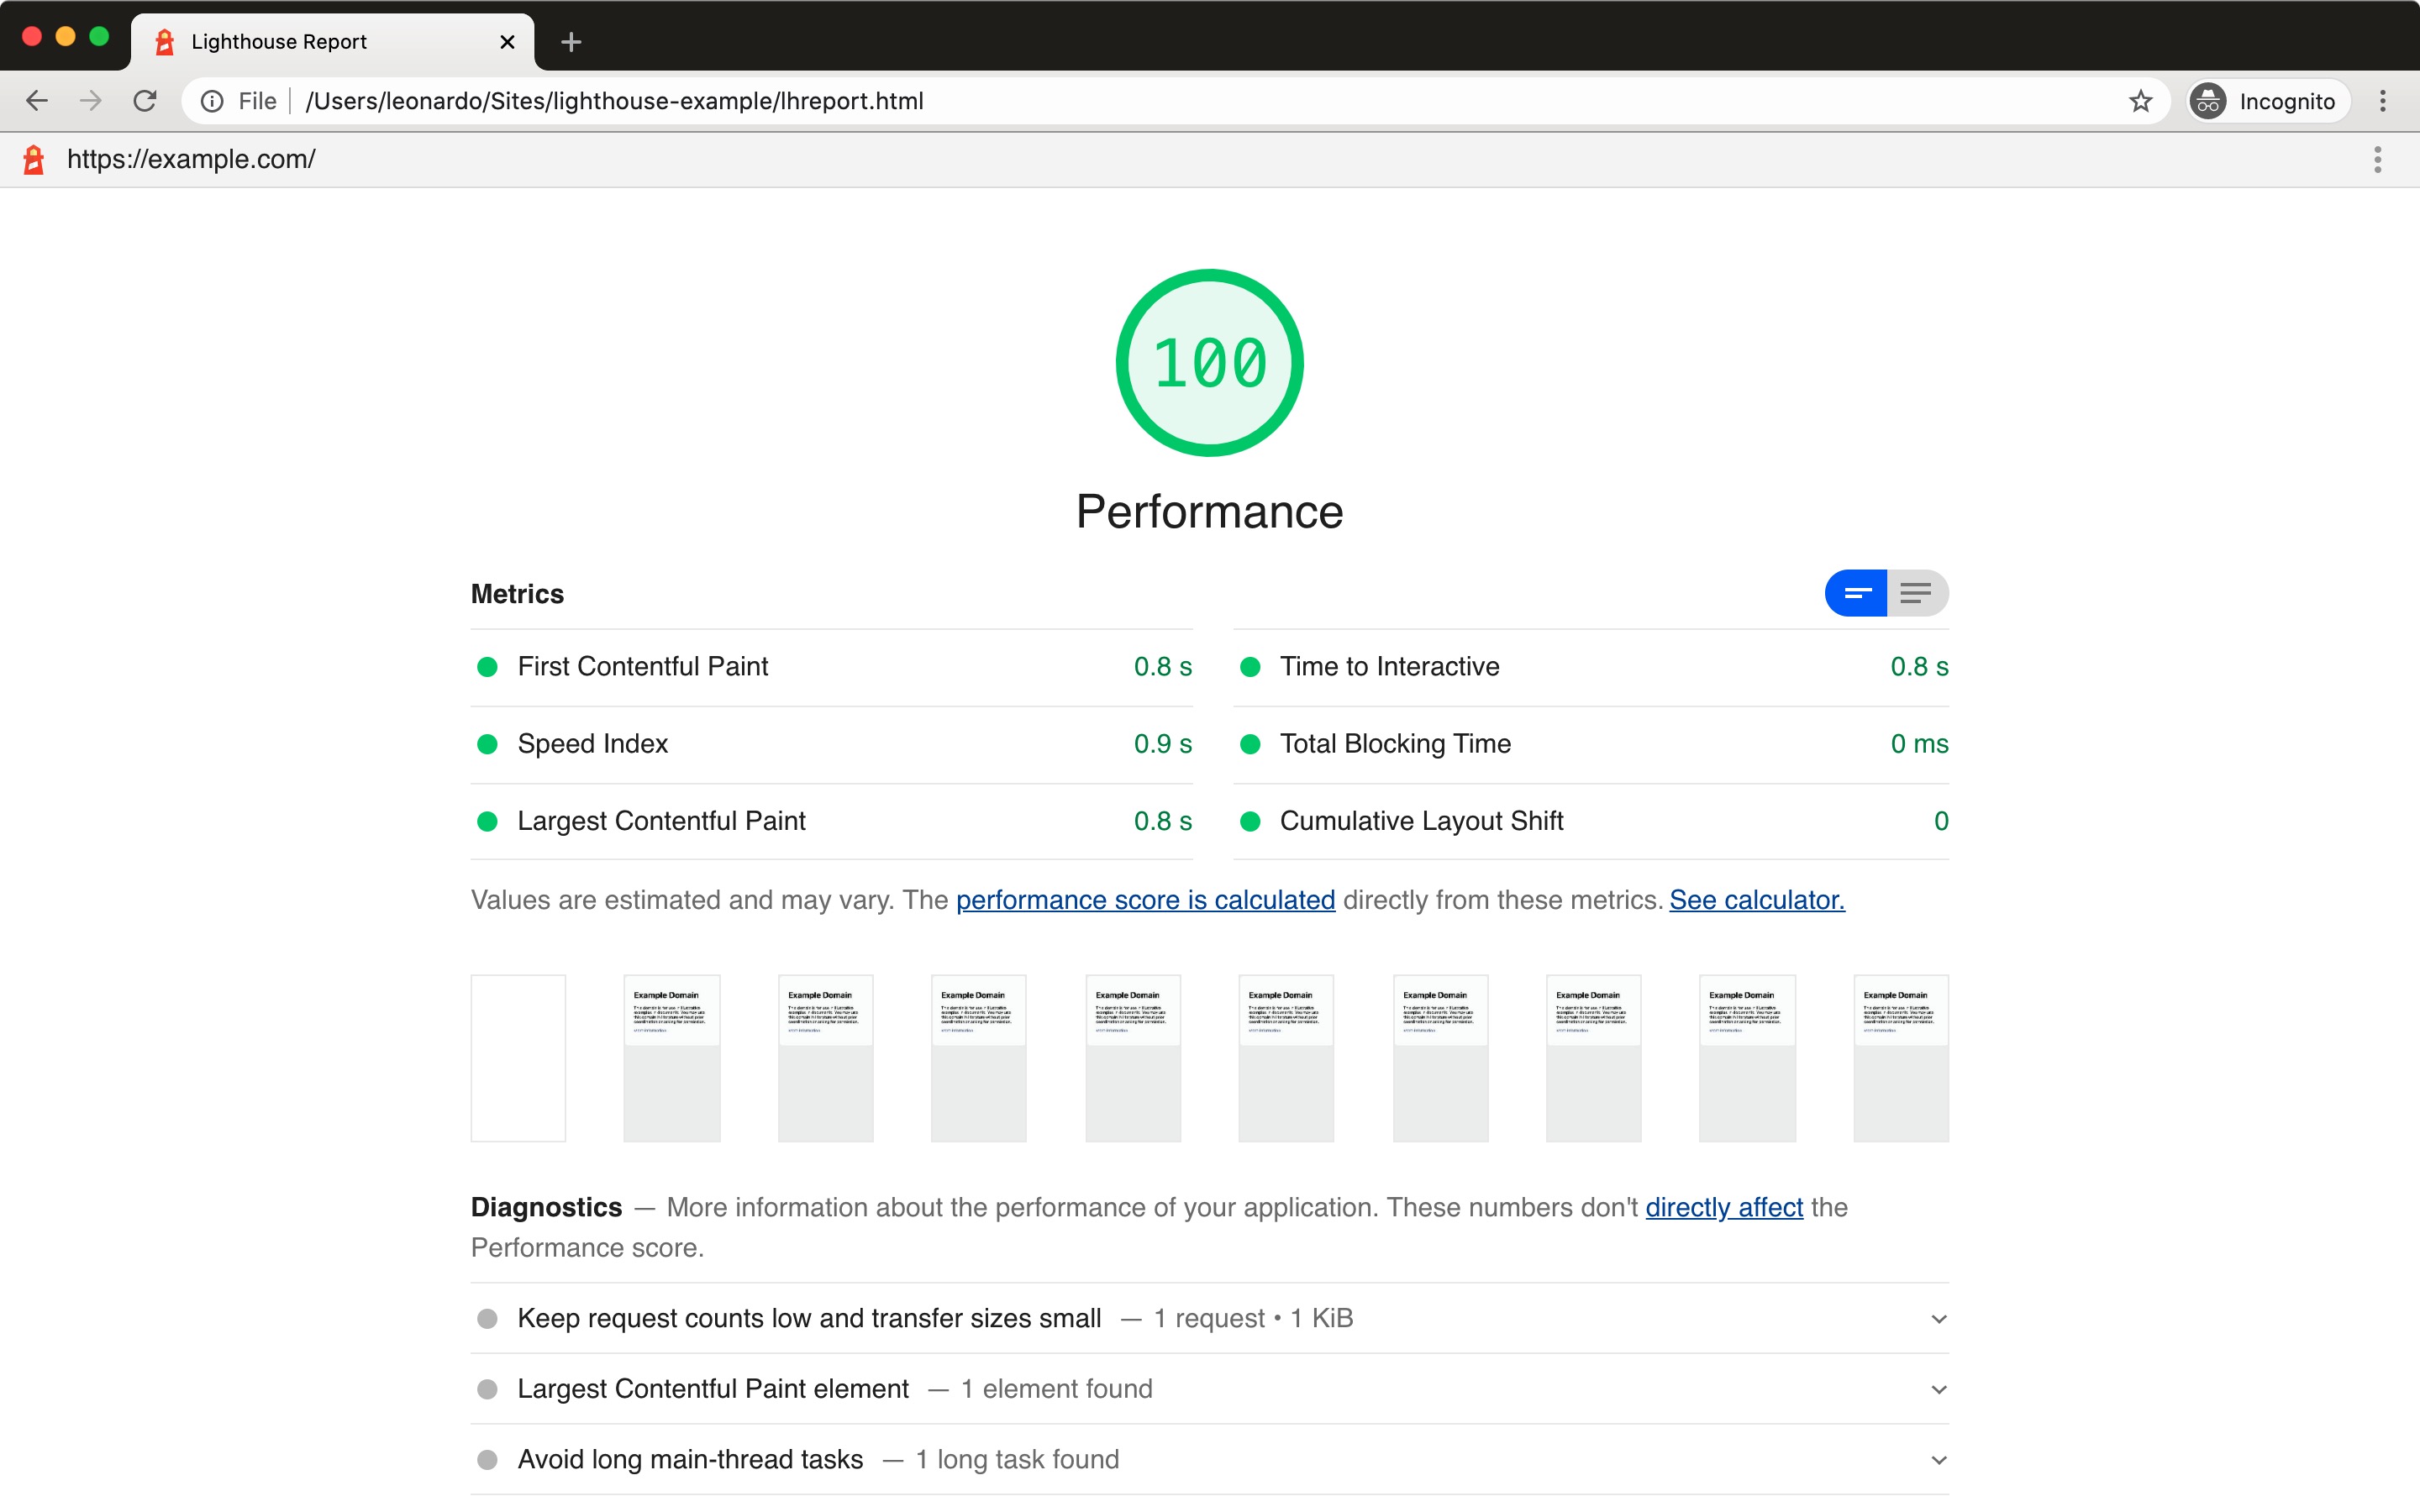
The HTML report is slightly different from the initial report of the post: only performance is audited as it was defined in the options.
Conclusions and up next
This post covered what Lighthouse is, why to use it, and how to use it programmatically.
The snippet from this blog post can be found in the lighthouse-examples GitHub repository. From here you can check out different recipes in the Lighthouse docs or keep reading the ones I have created:
- Getting asset transferred information with Lighthouse
- Generating screenshots with Lighthouse
- Getting Web Vitals information with Lighthouse
- Generating HAR files with Lighthouse
- My experience using Lighthouse in the real world
--
Photo by Robert Wiedemann ↗︎ on Unsplash ↗︎