
Tracking Test Coverage over time
Writing tests is important because it helps ensure that individual parts of your code work as intended, both initially and after modifications. Part of testing best practices is ensure that you have coverage, but how do you keep track of that over time? You can use Code Climate, Codecov and others but today I will share how to build something from scratch.
You might be asking yourself why building vs buying?
- Cost: these tools usually charge per user and companies are avoiding paying for tools unless considered essential. That means space for creative solutions;
- Customization: a tailor-made CLI can integrate better with your CI and you might want to organize tracking per team or domain. If you are working in a monolith, without custom development is quite difficult to map which feature belongs to whom.
With that in mind, I have a small codebase that I will use as an example for this post. This codebase contains 2 folders: utils has array.js and string.js and math contains calculator.js. These 3 files have simple functions that may/may not have tests, as you can see below:
export const square = (items) => items.map((item) => item * item);

export const cube = (items) => items.map((item) => item * item * item);
Tests
A JSON file and the HTML report below are generated when running jest with the --coverage option:
The HTML report is useful because it details exactly what is and what is not covered by tests. It also generates statistics in 4 different ways:
- Statements: individual lines of code, ex:
const x = 1; - Branches: decision paths within conditional statements, ex:
if (x > 0) { ... } else { ... } - Functions: named blocks of code, ex:
function add(a, b) { return a + b } - Lines: all lines of code, including comments and blank lines. This is not helpful
The JSON report is the source of information we want to use in the CLI. When researching the topic, I found an old project called circleci-coverage-github-reporter. By using istanbul-lib-coverage and istanbul-lib-report, this CLI parses the coverage-final.json file, loops through its content and renders a friendly list of files, their coverage, and emojis. The coverage number takes in consideration statements and branches in a weighted way: coverage = statements * 0.75 + branches * 0.25.
For this post, I quickly cleaned up / updated the code from the open-source project mentioned above and this is the output of the track script:
Code Coverage: 68.75% 💛
src/lib/           75.00% 💛
  array.js         66.67% 💛
  string.js       100.00% ✅
src/math/          68.75% 💛
  calculator.js    68.75% 💛
What is next?
The data mentioned above can be shared in different ways:
Pull Request comments
This is something often seen in third-party tools like Codecov:
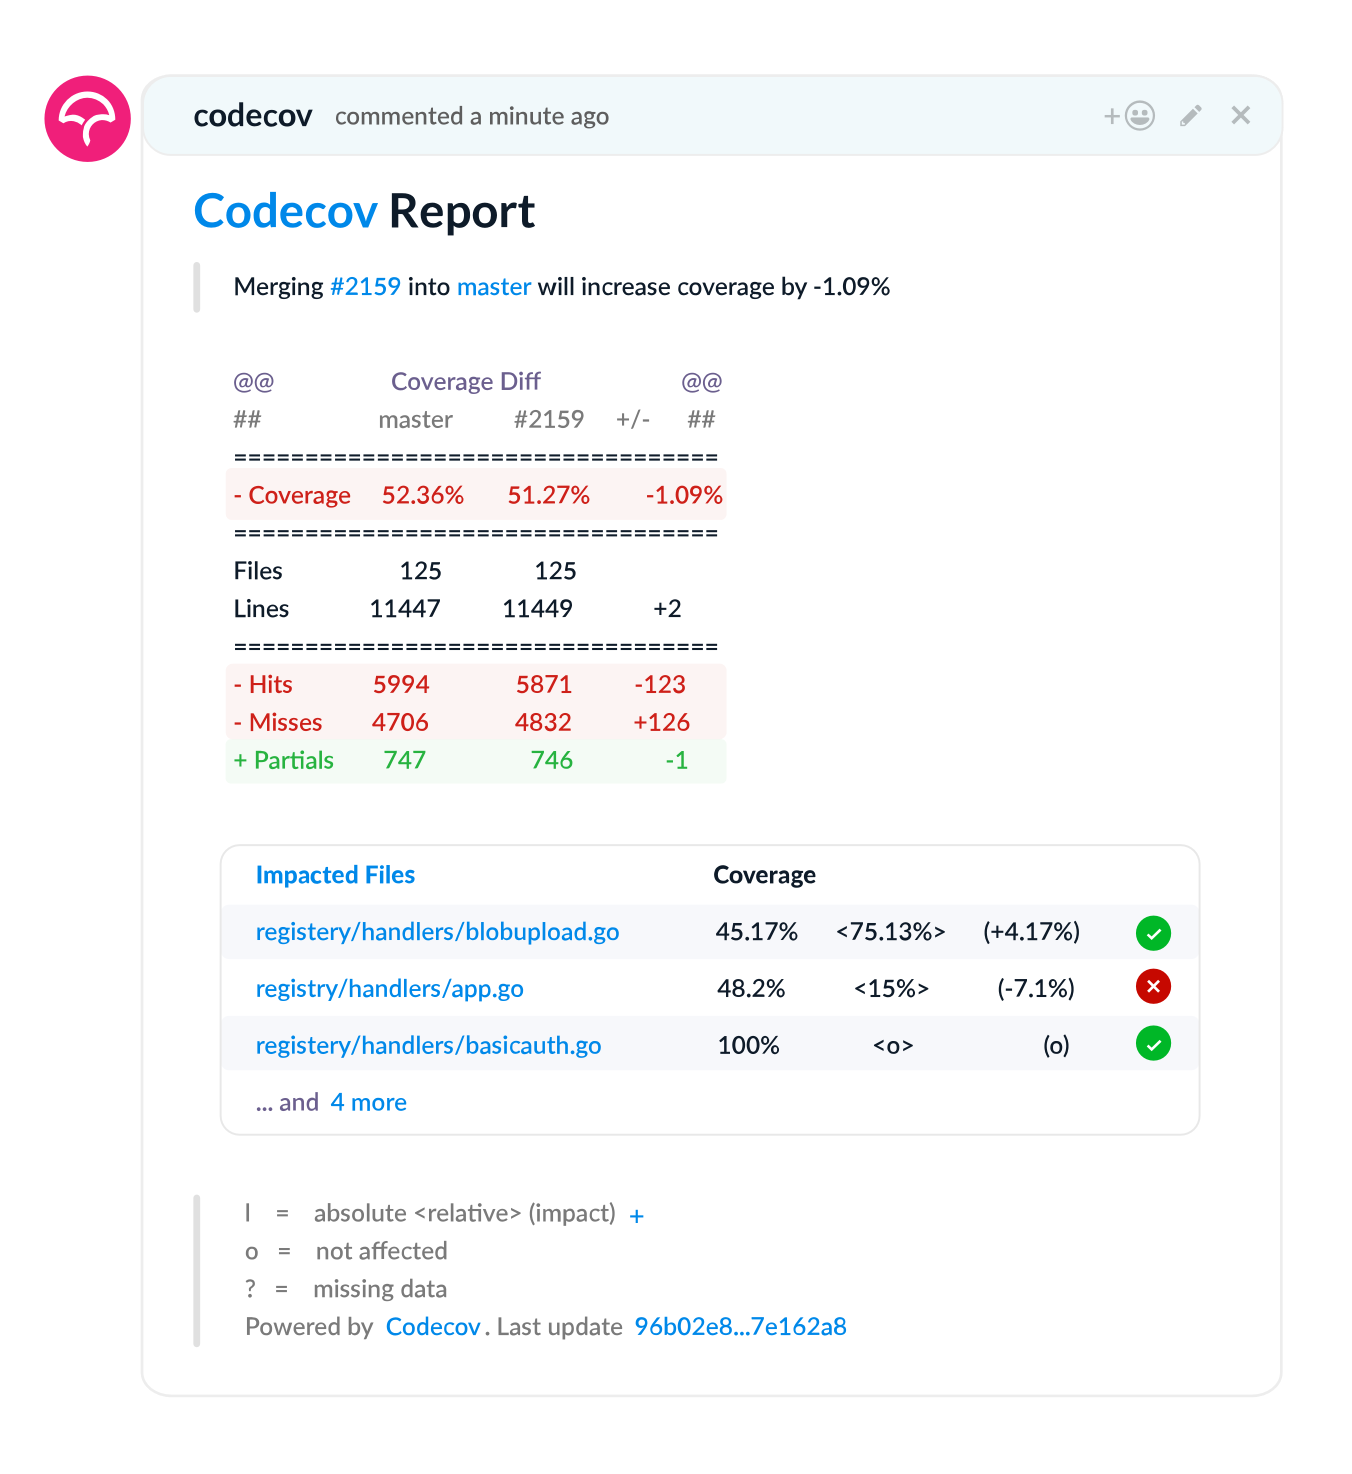
A similar result can be achieved by running the script in CI and posting a comment in a Pull Request. I previously used the Create or Update comment GitHub action for this use case.
A few extra tips:
- Leverage git comments to identify which files are being modified in the PR, then run the script. This will avoid spamming PRs that touch files not related to JS/TS code.
- Define what needs to be tracked: create a data structure mapping what needs to be tracked and who is responsible for it, for example, Team A is responsible for the folder
liband Team B is responsible for the foldermath. By doing this you can create a healthy competition to see who has the highest test coverage ;)
Slack messages
Instead of posting in a pull request, the formatted information of the test coverage can be posted in Slack (or any other messaging app). This is something I haven't done before but it is straightforward to build.
Long term storage
The final numbers - aggregated by folder or team - can also be stored for future reference. For this use case, consider using a time series database like Prometheus or a tool like Datadog. Another option is tracking this in a relational database.
In both cases, the information can be shown in dashboards in a very informative way. I previously used Datadog and created dashboards organized by teams and this tool also offers alarms, which can be triggered, for example, if the overall coverage is below a specific number.
Conclusion
The end of Zero Interest Rate Policy (ZIRP) impacted companies in different ways, including decisions regarding buy x build solutions. In this post, I showed that building something from zero is not impossible and within hours, you can highlight test coverage numbers in different ways.