
45 ways to visualize my workouts data
Last year I started going to F45 for exercise and I have been going ever since. They have a heart monitor called Lionheart ↗︎ that tracks your heart rate and other metrics during the class, but it's not easy to get the data out of it.
I saw a great post ↗︎ showing how to connect F45 to Strava and I decided to give it a try. In my first attempt last year, I didn't use Charles. I used Proxyman and got the data out of it.
The goal of having the data was to build something fun and interesting. I didn't do anything with it for a while but fast-forward to now, I decided to play with the data again and build different data visualizations, inspired by 1 dataset. 100 visualizations ↗︎.
The post title says 45 ways, but it is clickbait and a pun with the studio name. My first data visualization was the heart rate candlestick chart from their app and from there I started adding charts based on the data I had. Didn't get to 45 but I did get to 36.
Getting the data
James' post shows that you can get the data from the F45 API by intercepting the requests with Charles. At the time of his post, the API didn't have any authentication, but now there is a Bearer token that you need to use to get the data.
As of today, this is how you can get the data:
- Install Charles in your computer.
- Install the certificate in your phone and set the proxy to the computer's IP address.
- Inside Charles, add
api.lionheart.f45.comin the SSL Proxying Settings.
If everything is working, you should be able to see the requests in Charles and you can get the data from the API, as the following screenshot shows:
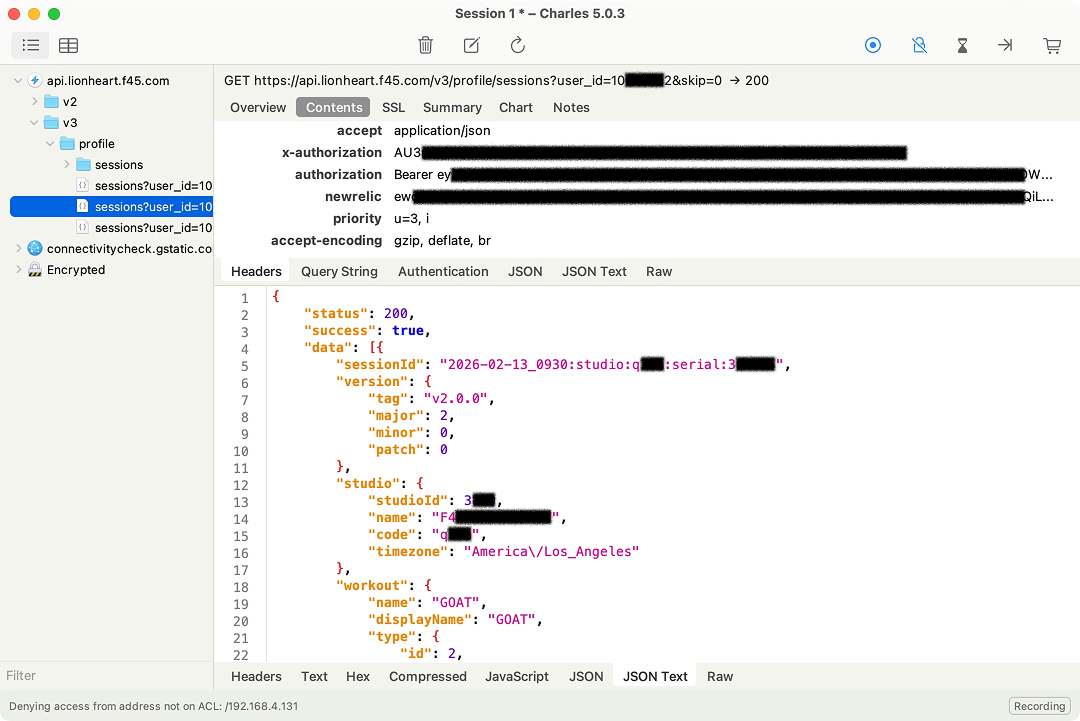
You can get the token and use curl to test things, like this:
curl -X GET "https://api.lionheart.f45.com/v3/profile/sessions?user_id=${F45_USER_ID}" -H "Authorization: Bearer ${F45_TOKEN}"The pagination is handled by the skip parameter, so you can get all the data by looping through the pages. A simple script was used to get the data and save it to a file.
Conclusions
I think I only touched the surface of what can be done with the data. I might go back to it and add more visualizations. Another thing to automate is creating a GitHub Action to update the data on a daily basis.