Using HAR files to analyze performance over time
When I consider the performance of a website, the first things that come to mind are; looking at the requests of a page, understanding what resources are being loaded, and how long these resources take to be available to users.

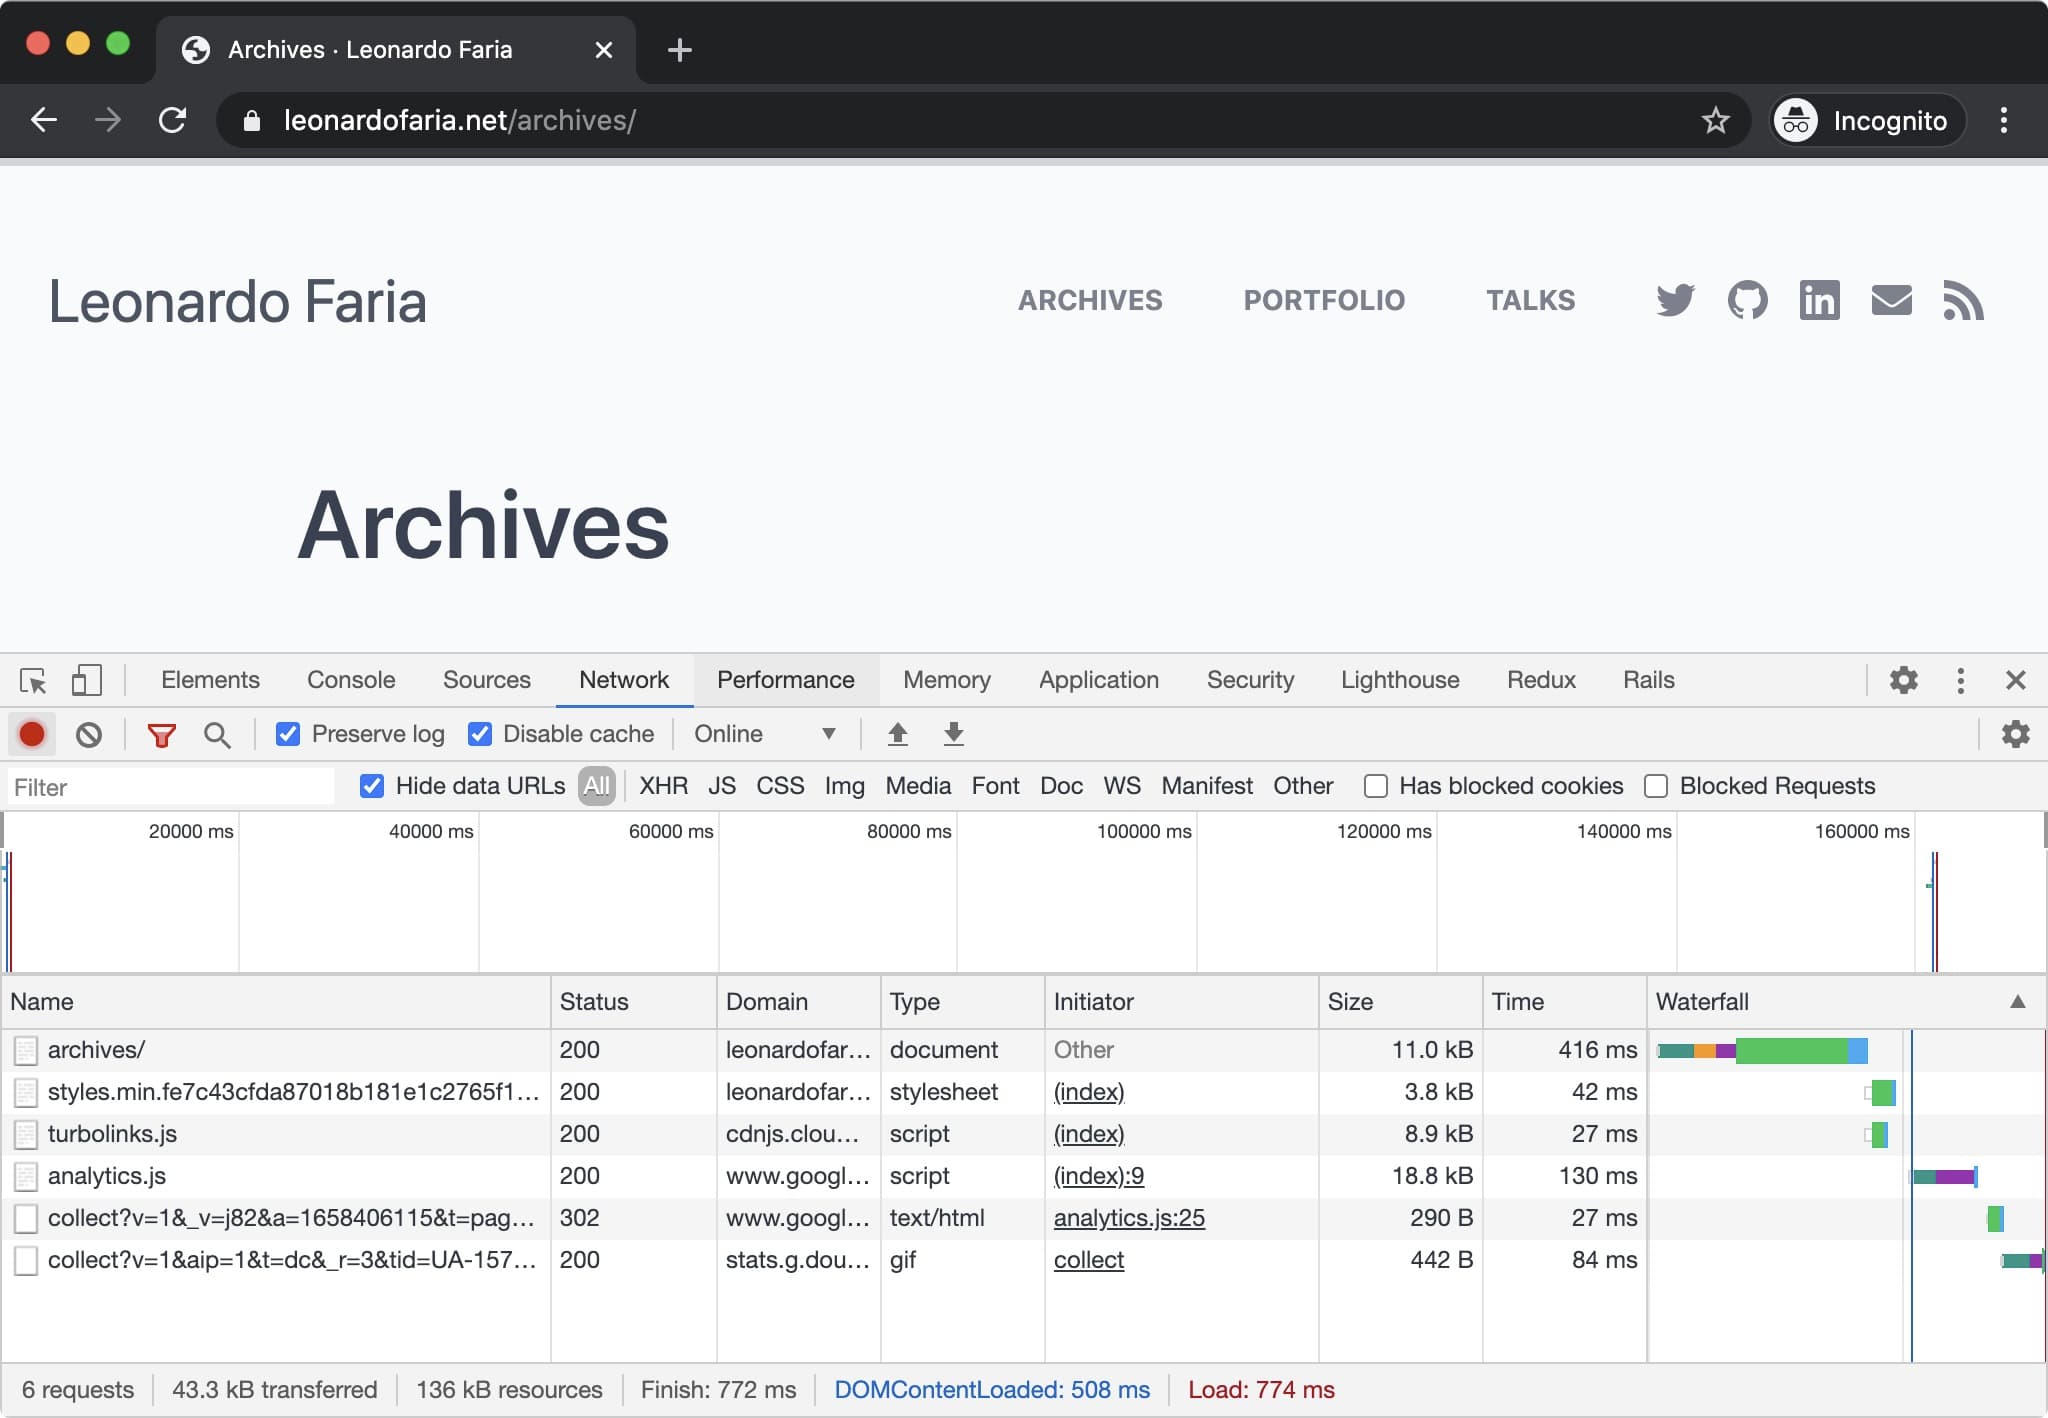
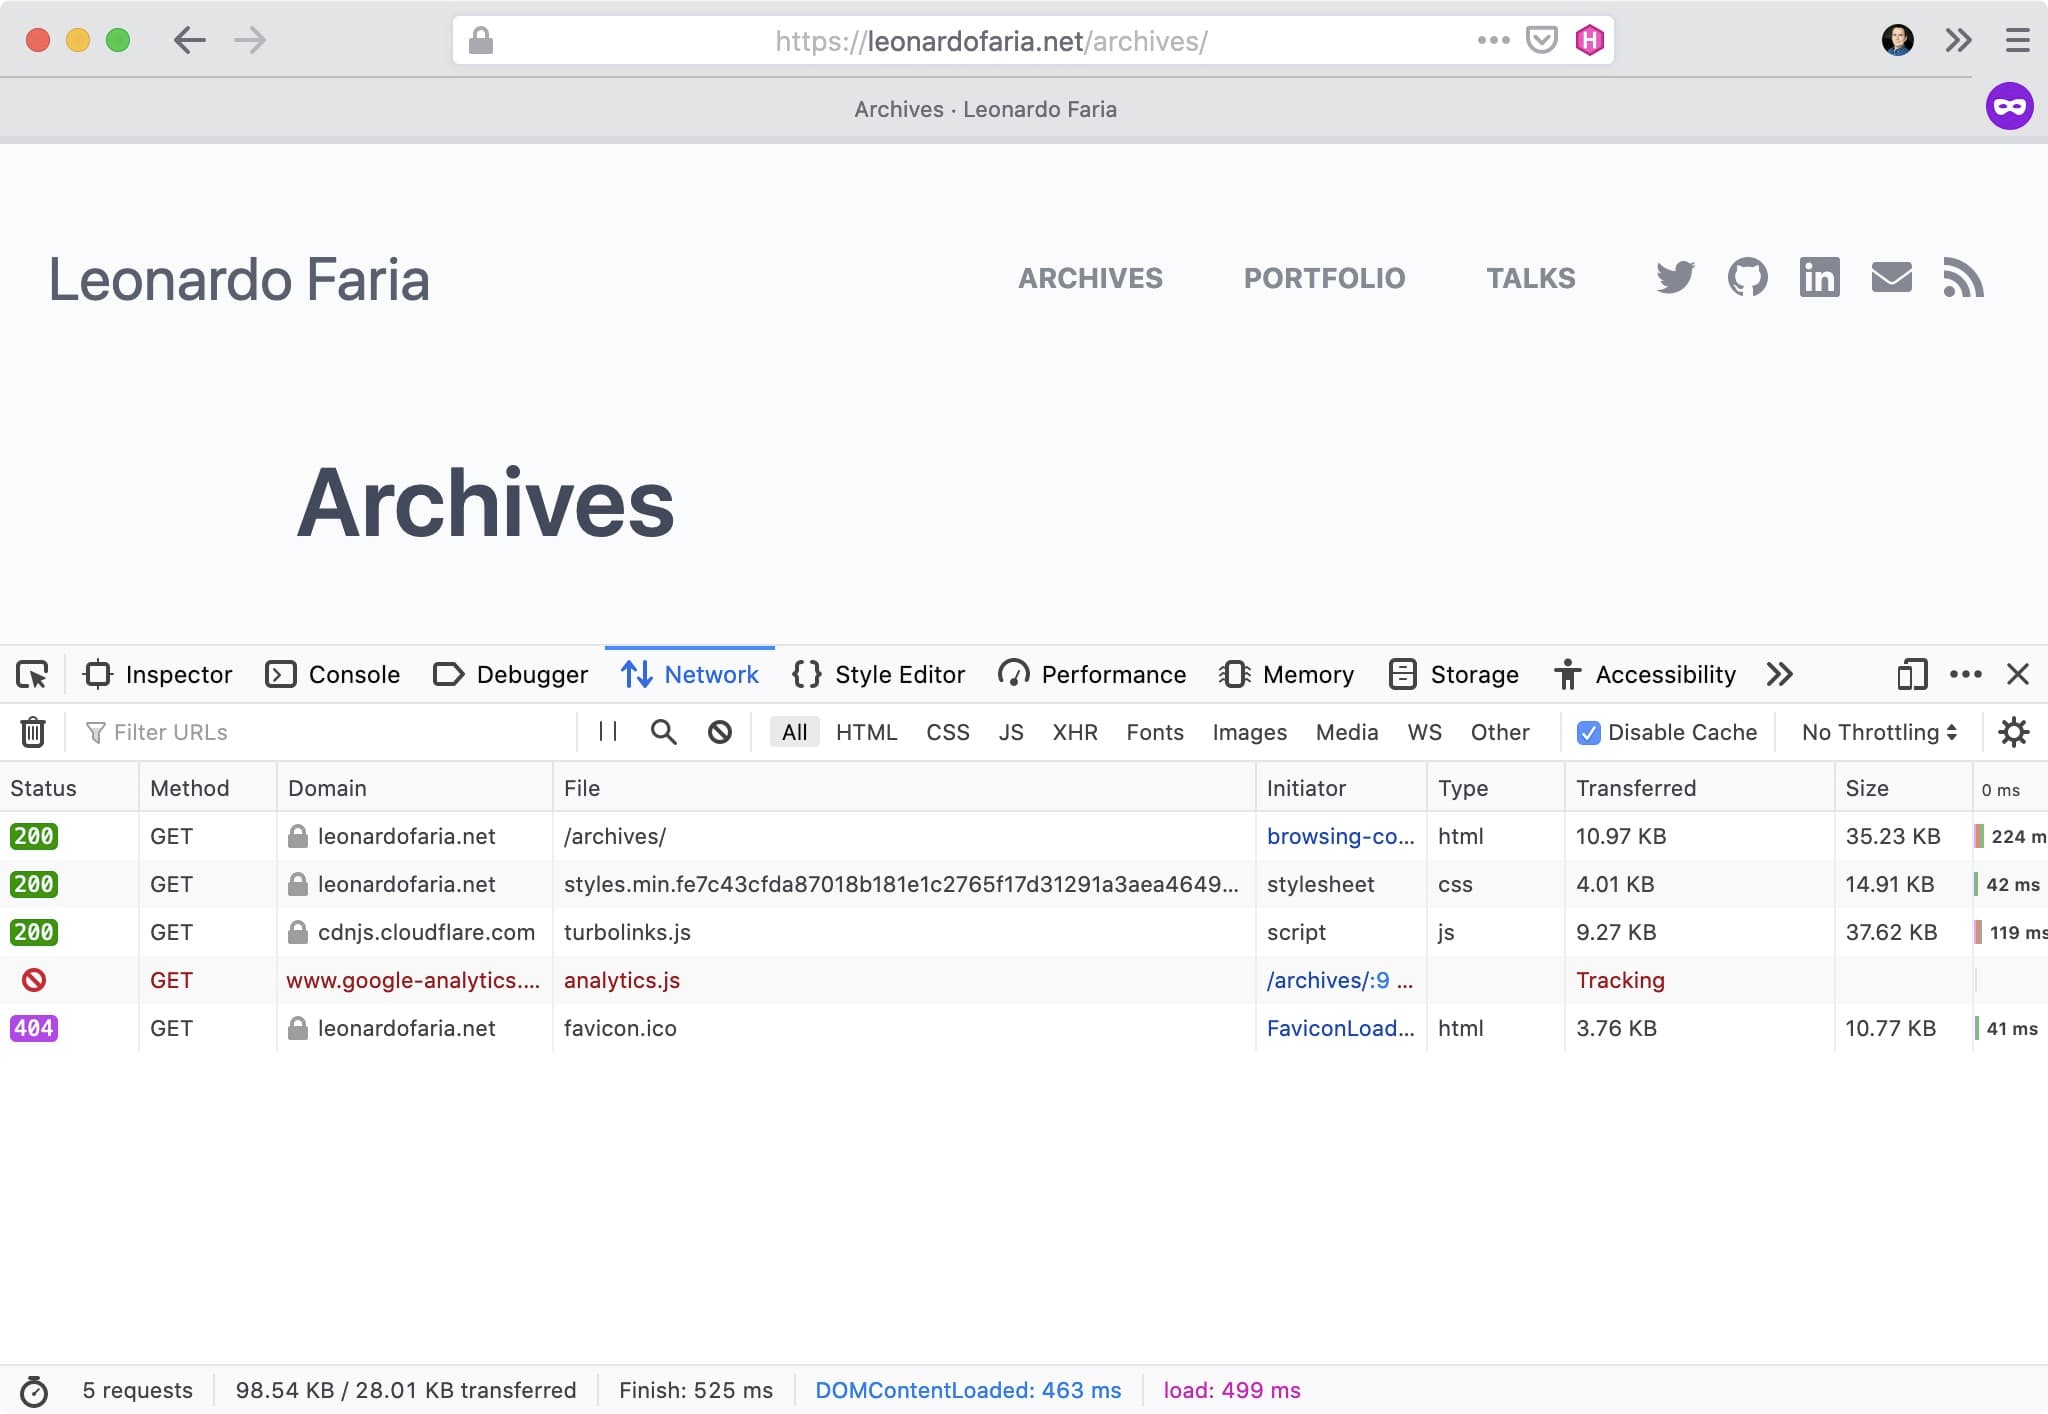
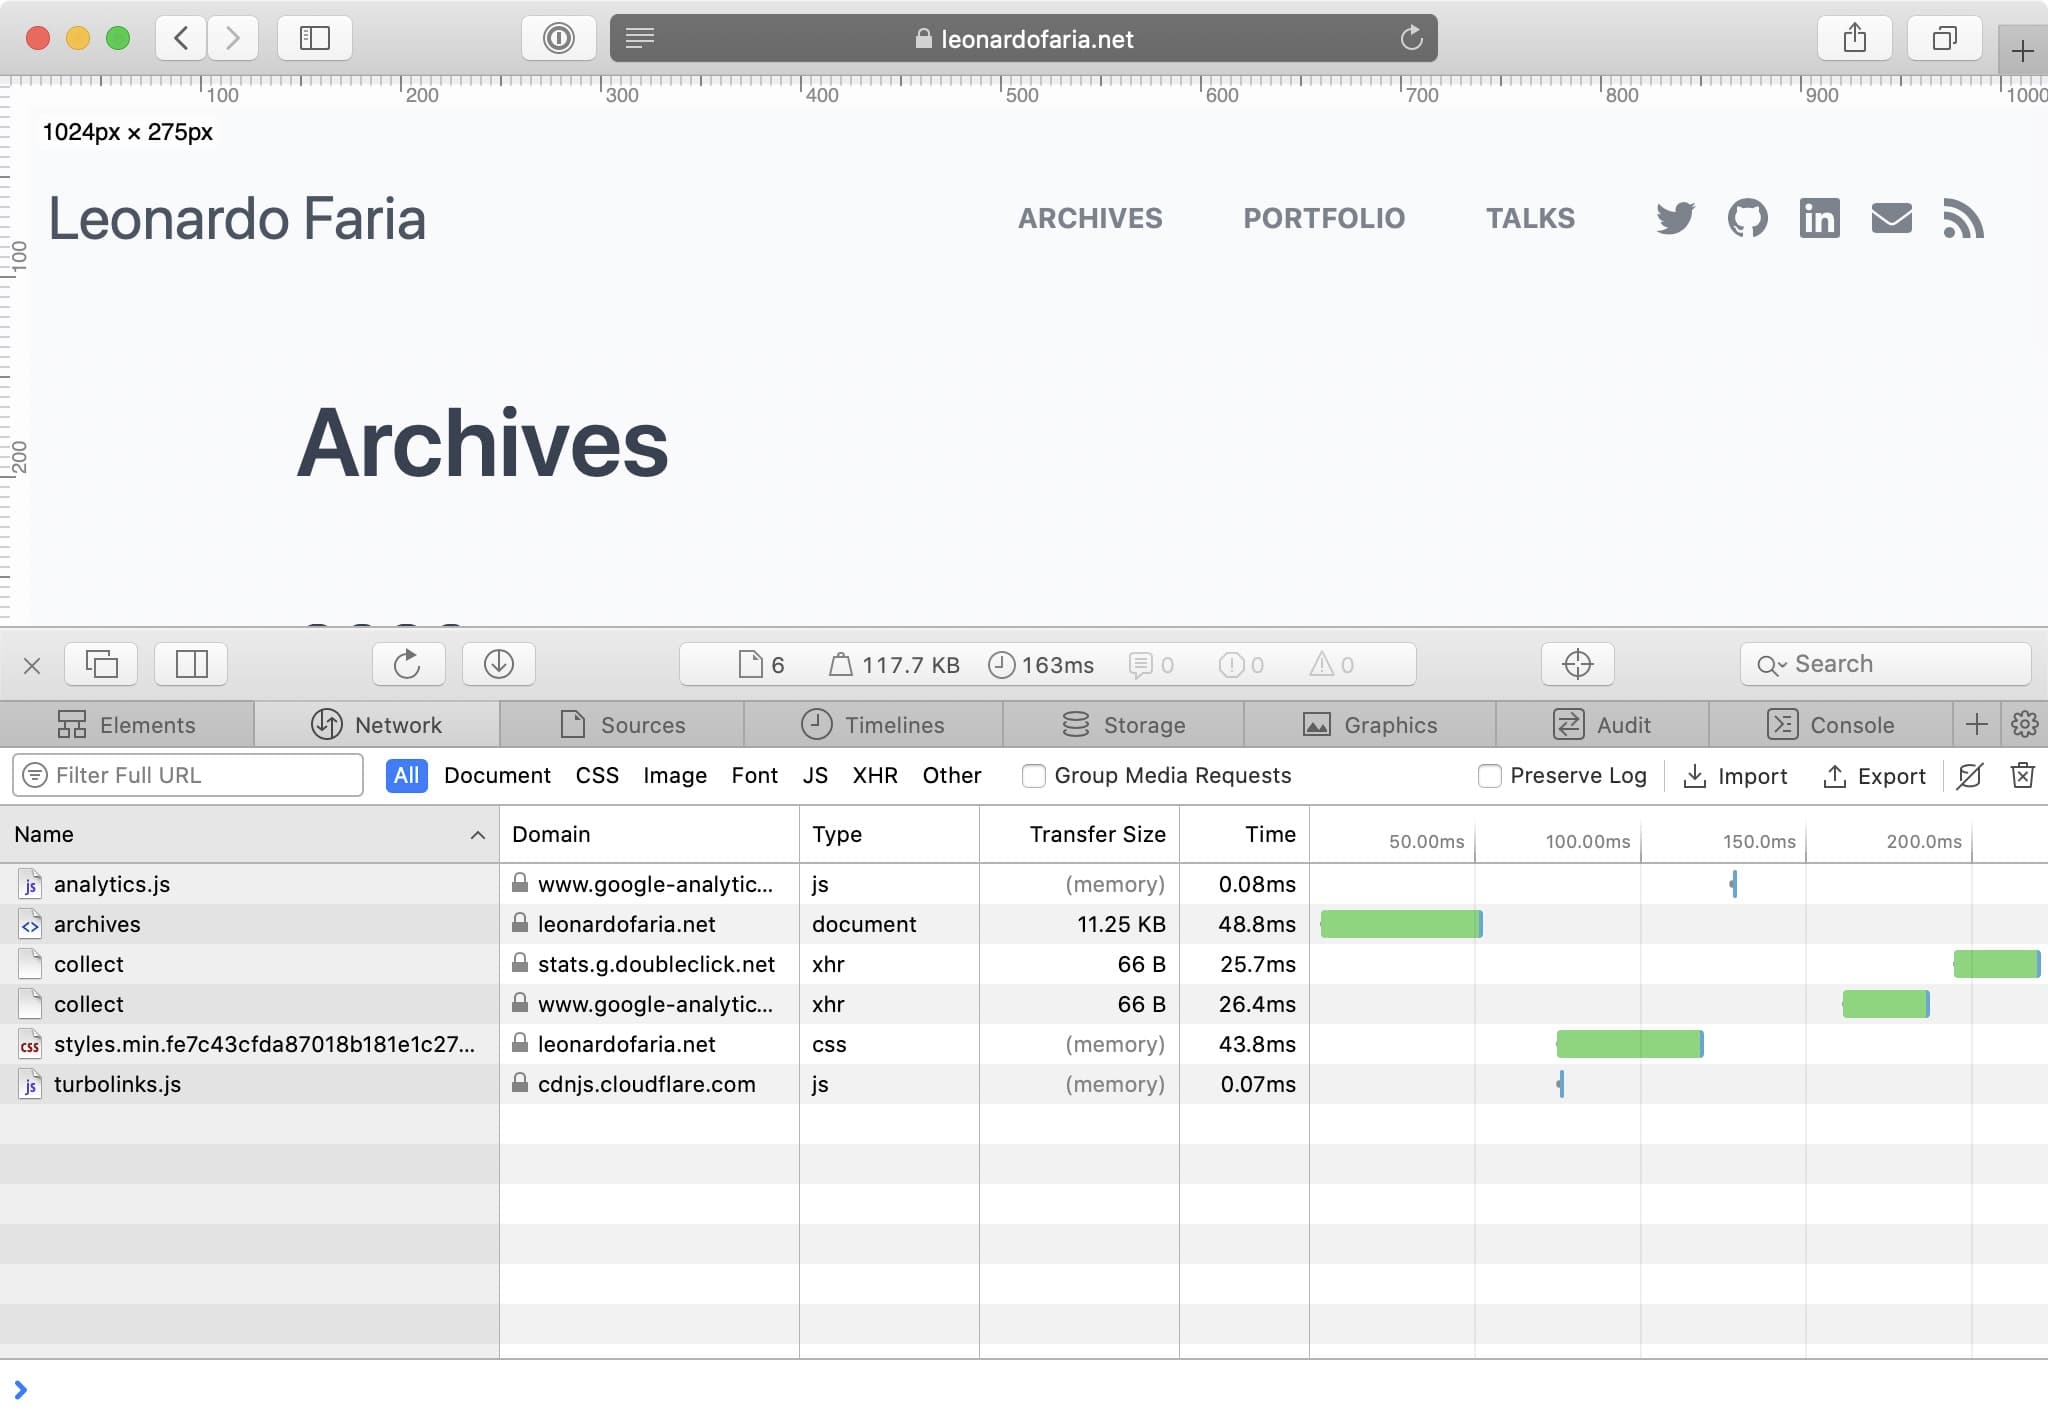
The network tab will give you a table containing all assets loaded on the page, as well as relevant information about their origin (domain, HTTP status code, size), who initiated the request, and the order in which they were loaded in a waterfall representation. You can add more information to this table by right-clicking one of the table headers and choosing other columns.
The size, time and waterfall columns will be crucial to understanding the performance of a page. The size value will present the gzipped size of the resource (when applicable), while the time column shows the total duration from the start of the request to the receipt of the final byte in the response. Last, but not least, the waterfall column demonstrates when the asset is loaded along with the other requests.
Performance improvements are noticeable by changes in your code/environment. So how do we keep track of what is being analyzed by the Network tab? By exporting the page in HAR format.
What is a HAR file?
A HAR (short for HTTP Archive) file is a JSON file containing all information about a browser's interactions with a page. It will contain the HTML document and its respective JS and CSS files. Along with this content, a HAR file will also contain all headers' information and the browser metadata (i.e. the time of each request).
It is important to mention here that cookies and form data will also be logged in the file, so be careful to not include sensitive information (personal details, passwords, credit card numbers) while auditing pages. Also, it is preferable to audit pages in private windows, which avoids browsers' extensions. It is invaluable to avoid a browser's extensions since they may modify the loading times of a page.
Generating HAR files
Google Chrome
- Close all incognito windows in Google Chrome.
- Open a new incognito window in Google Chrome.
- Go to View > Developer > Developers Tools.
- In the Developer Tools panel, choose the Network tab.
- Check the Preserve Log and Disable cache checkboxes to record all interactions.
- Refresh the page.
- Click the Export HAR (down arrow icon) to export the HAR file.
- Save the HAR file.
Firefox
- Close all private windows in Firefox.
- Open a new private window in Firefox.
- Go to Tools > Developer > Network or ctrl-shift-E.
- Refresh the page.
- In the Cog icon (upper right side of the page), choose Save All As Har.
- Save the HAR file.

Safari
- Ensure that Show Develop menu in menu bar checkbox is checked under Safari > Preferences > Advanced.
- Choose File > Open New Private Window.
- Visit the web page where the issue occurs.
- Choose Develop > Show Web Inspector. The Web Inspector window appears.
- Refresh the page.
- Click Export on the upper right side of the pane.
- Save the HAR file.

Reading HAR files
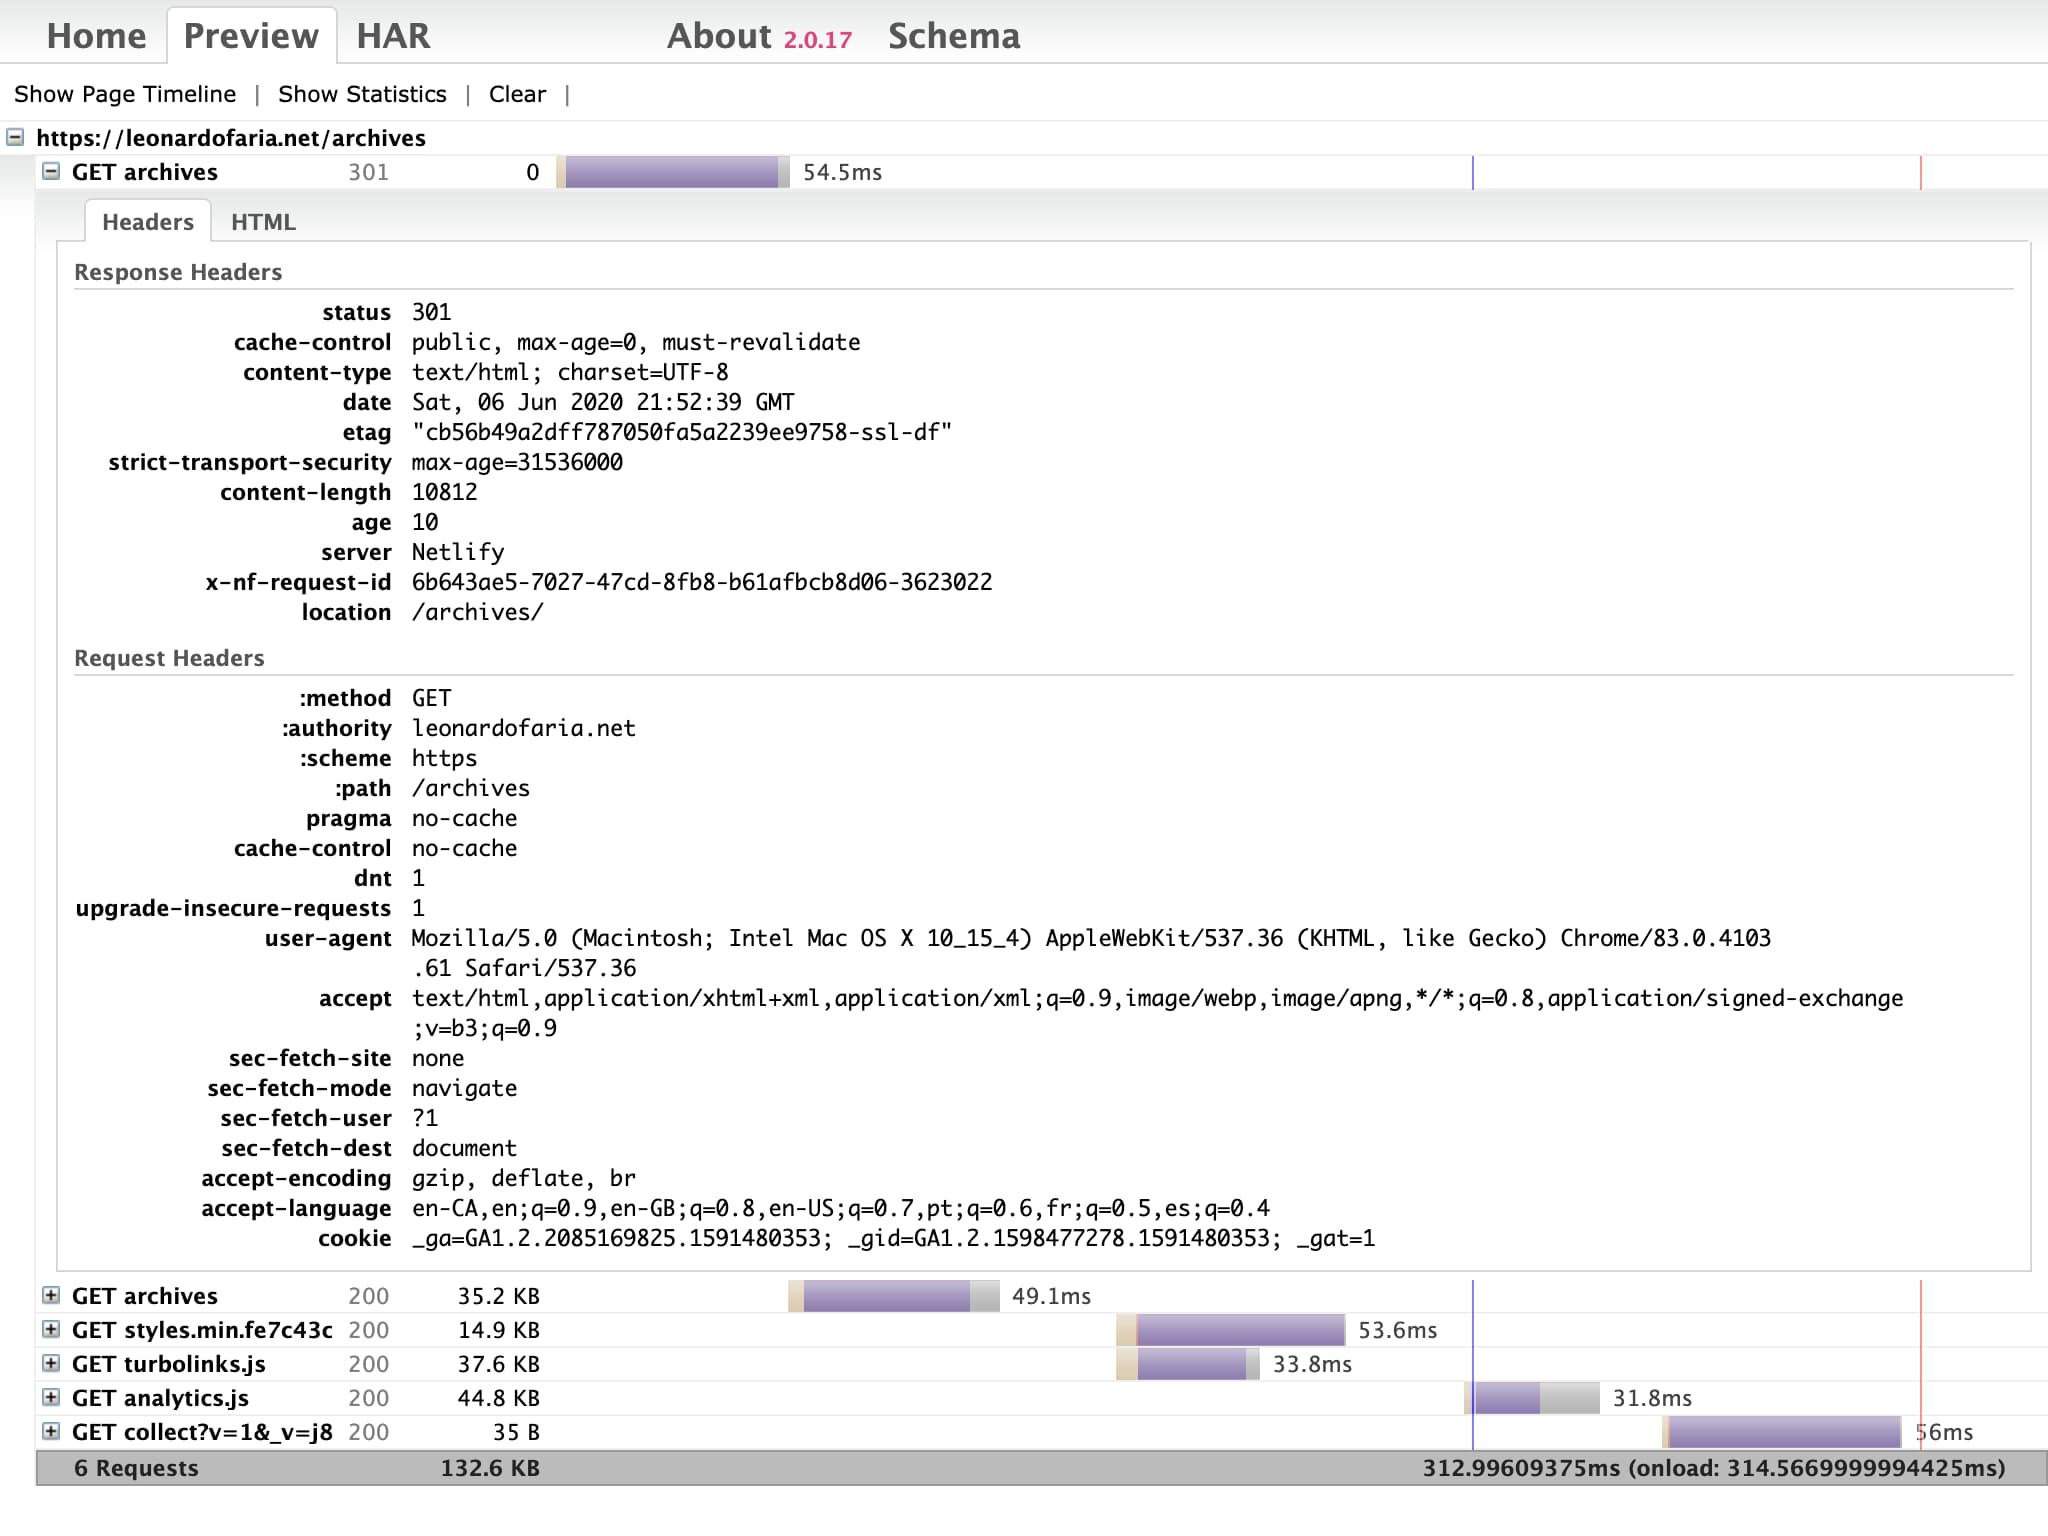
Once you have a HAR file, you can try a few HAR viewers online. My personal favourite is the one created by Jan Odavarko.

What I like about this viewer in particular is the fact you can have multiple files open at the same time, which makes it easier to compare them.
Using HAR files to analyze the performance of a page
HAR files can be useful to collect information about the assets of a page. Since you have detailed information about their content, you can compare what has improved (or in some cases, not improved) after a new feature is launched or a redesign is completed, for example. During my workflow, I like to keep track of the final size/time values of a few pages of the product that I am working on.
