
Getting asset transferred information with Lighthouse
Have you ever about thought tracking what is added to a page or web app? Did not know how your website became 15MB? Sounds like it is time to track this data!
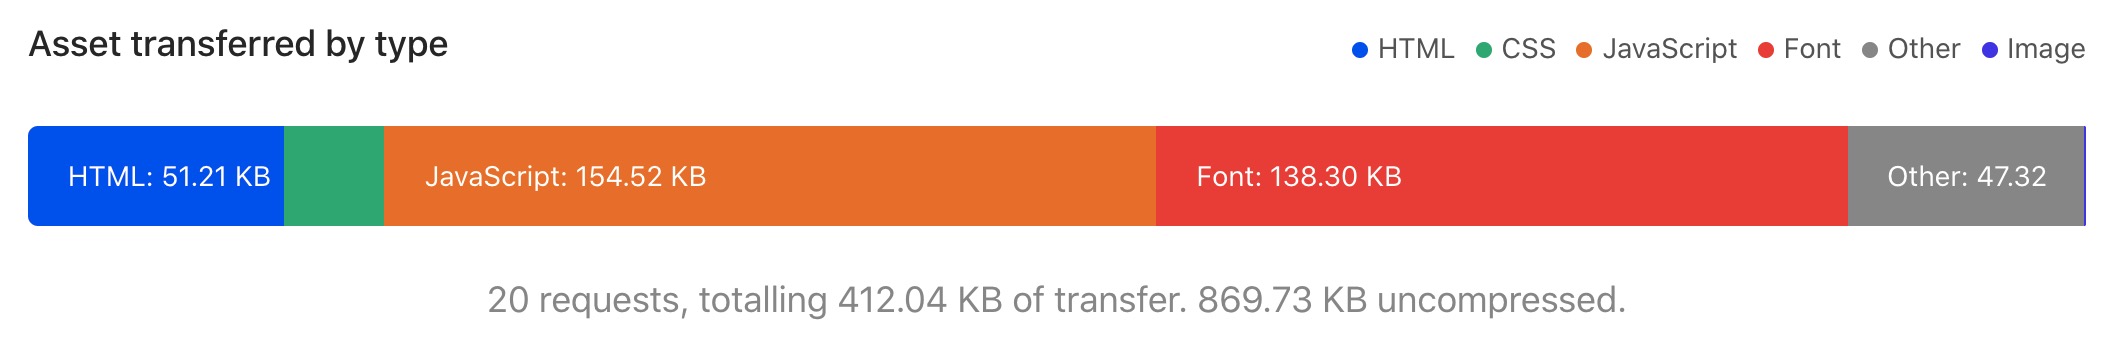
Calibre ↗︎, one of my favourite web performance tools, creates charts, such as the one above, to illustrate what is being transferred to users when they visit your page or use your web app.
In this post you will learn how to collect similar data using Lighthouse. Here is the recipe (from my lighthouse-examples GitHub repository):
const lighthouse = require('lighthouse');
const chromeLauncher = require('chrome-launcher');

(async () => {
  const chrome = await chromeLauncher.launch({chromeFlags: ['--headless']});
  const options = {port: chrome.port};
  const runnerResult = await lighthouse('https://leonardofaria.net', options);

  const assets = {};
  runnerResult.lhr.audits['resource-summary'].details.items
    .filter(({ transferSize }) => transferSize > 0)
    .forEach(({ resourceType, transferSize }) => {
      assets[resourceType] = transferSize;
    });

  console.log(assets);

  await chrome.kill();
})();
The script is very straightforward: we import Lighthouse and Chrome Launcher (lines 1-2) and run the audit against the URL, storing its results in the runnerResult variable.
The runnerResult variable stores 3 main objects:
lhr: Lighthouse Result Object contains run metadata (Lighthouse version, fetch time) and the audit resultsartifacts: The data used by the auditreport: A JSON/HTML/CSV report
The magic starts happening in line 10: we dig into the results of the audits and get information from the resource summary audit (line 16). The output of the script is:
{
  total: 400584,
  image: 321981,
  font: 36954,
  script: 27788,
  document: 7912,
  stylesheet: 5274,
  other: 675,
  'third-party': 66493
}
If this is not enough information, and you also want to include the number of requests, you can just return the items object and skip all filter and loop steps: runnerResult.lhr.audits['resource-summary'].details.items.
The image above shows what is inside the resource-summary audit:
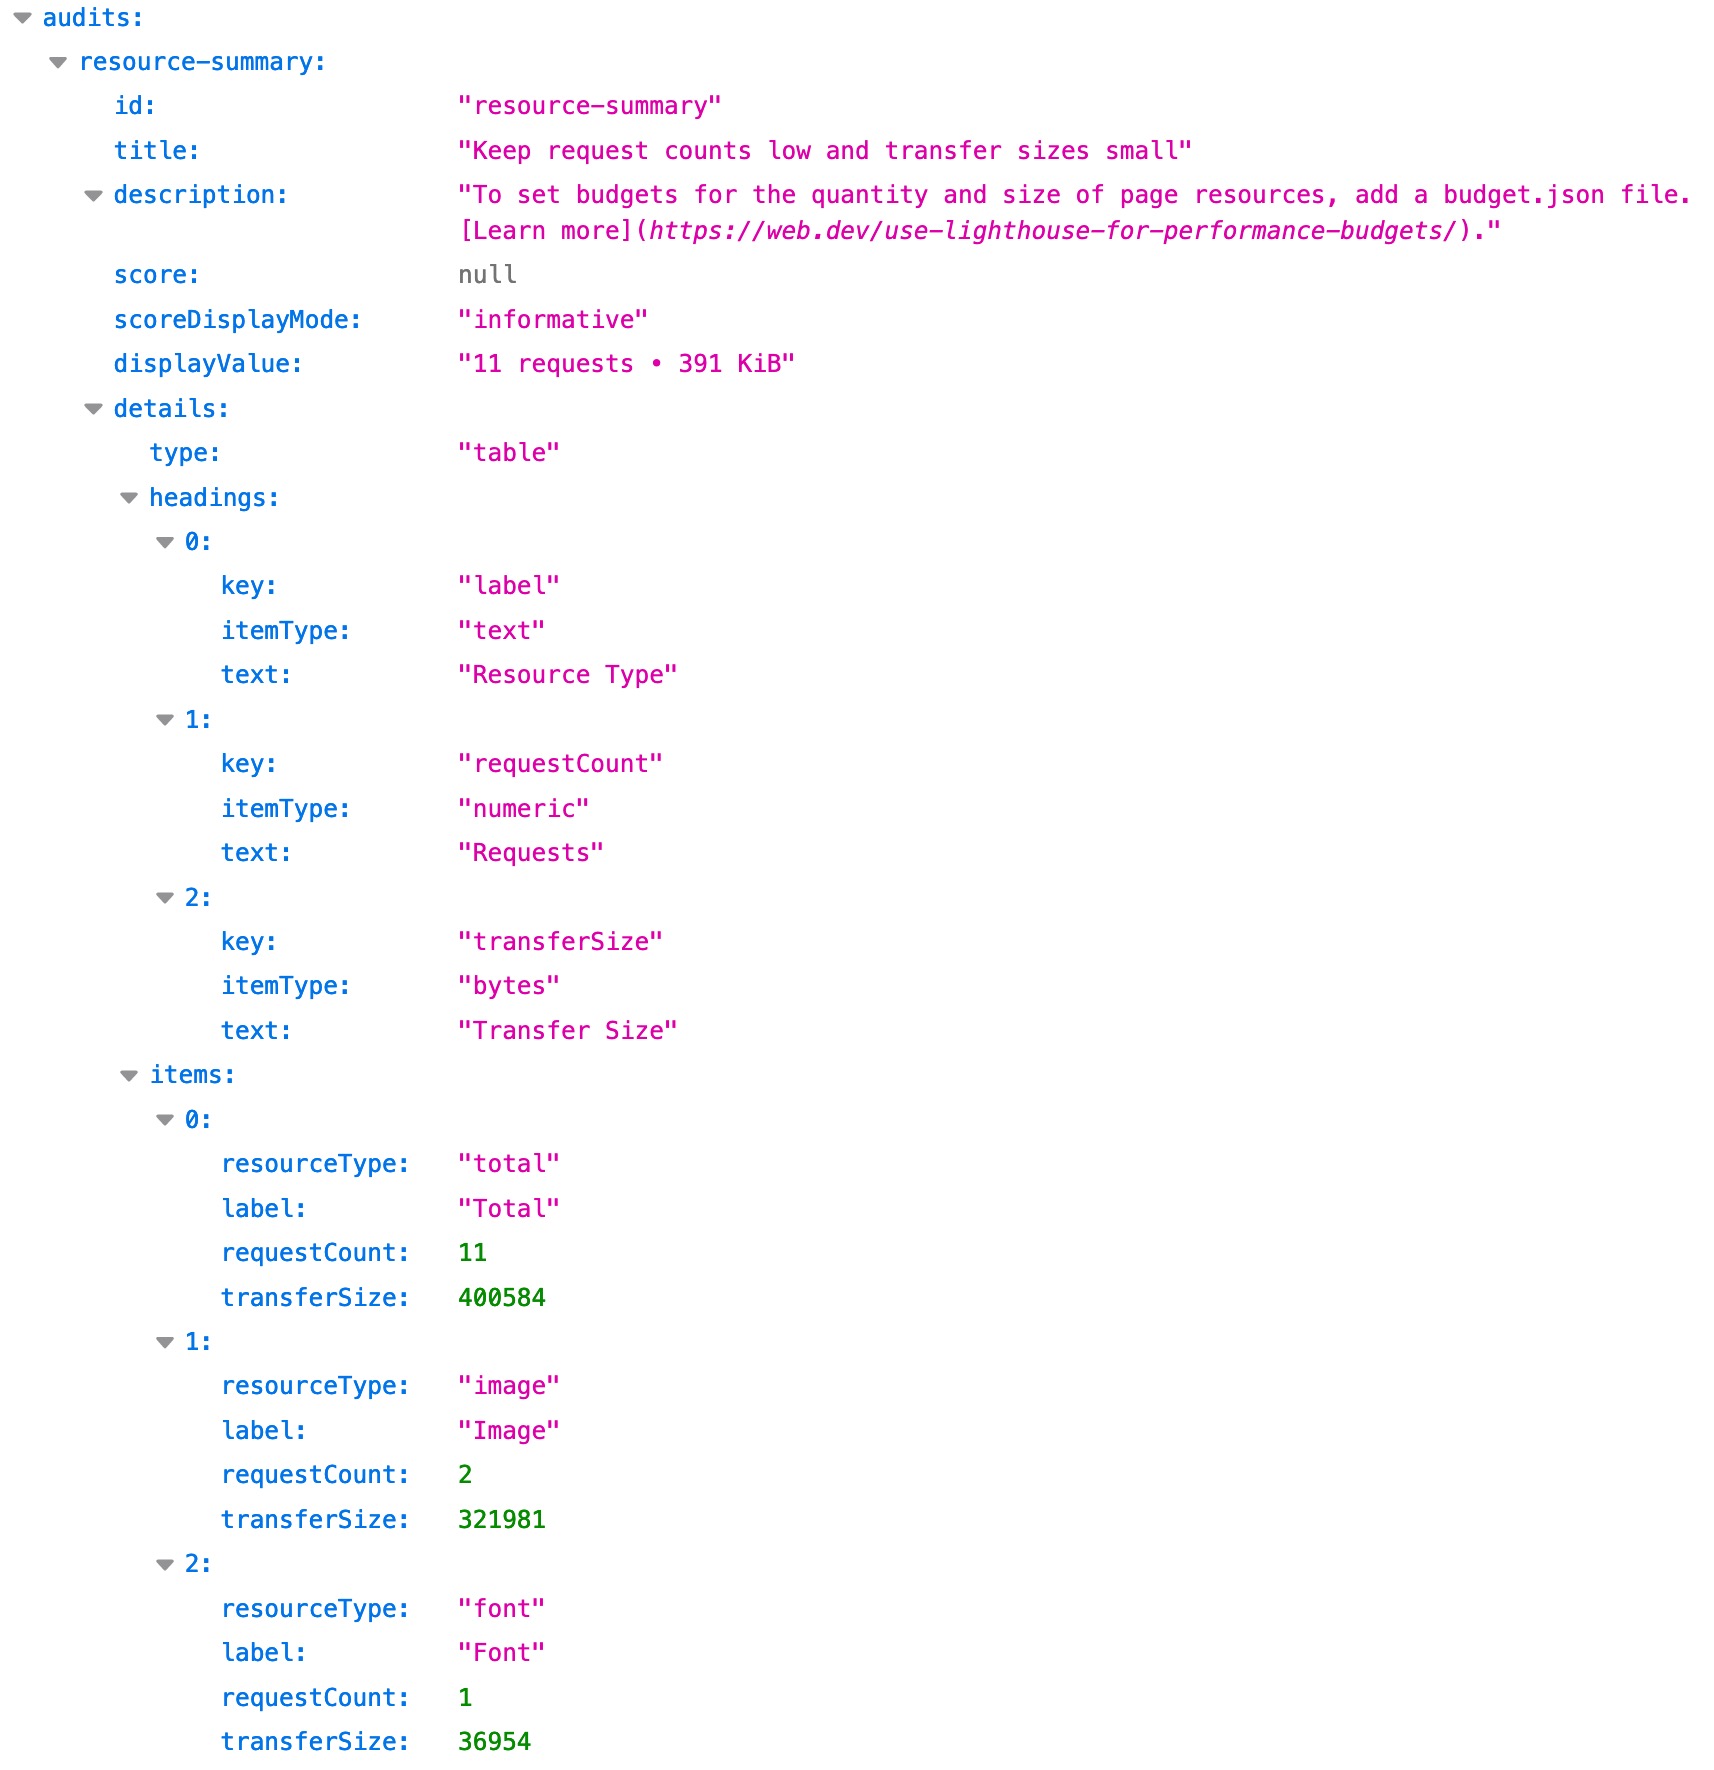
Curious to know how the JSON is shown in the image? This is how Firefox renders JSON files by default. I really wish other browsers implemented this by default.
Why do we need this?
This script is useful in order to closely follow what is being sent to users. In my case, this data is stored daily and is used to identify if new features added in the codebase dramatically impact the page rendering.
Can you think of different applications of this tool? Let me know in the comments!