
Generating Web Vitals information with Lighthouse
Earlier this year ↗︎, Google announced that “page experience” would impact its search ranking. A few weeks ago, they announced that the new page experience signals will roll out in May 2021. But what are these page experience signals?
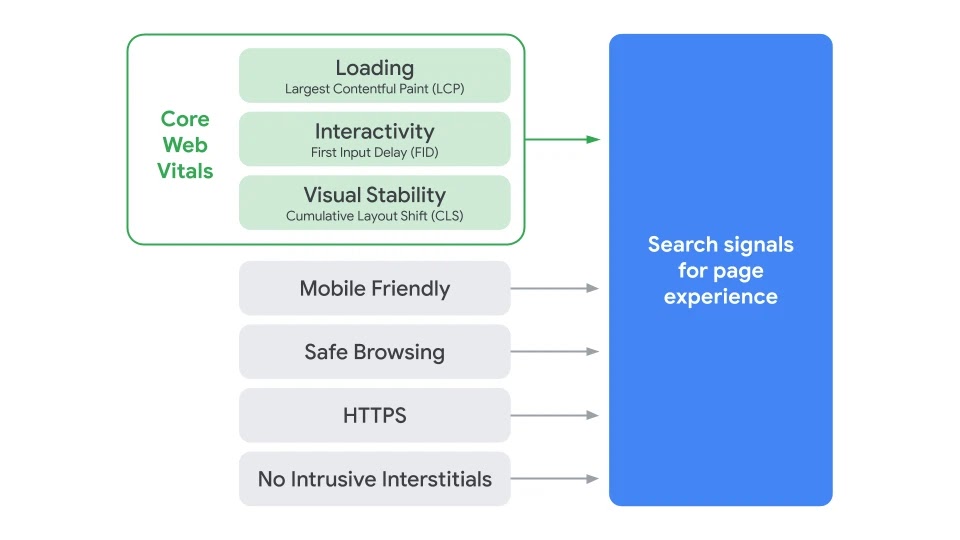
The page experience ↗︎ signal measures aspects of how users perceive the experience of interacting with a web page. Offering mobile-friendly pages and serving content over HTTPS is something we have been doing for a while but soon slow sites may lose their spot in the Google page ranking algorithm.
What are Core Web Vitals
Core Web Vitals are the subset of Web Vitals that apply to all web pages, should be measured by all site owners, and will be surfaced across all Google tools. Each of the Core Web Vitals represents a distinct facet of the user experience, is measurable in the field, and reflects the real-world experience of a critical user-centric outcome.
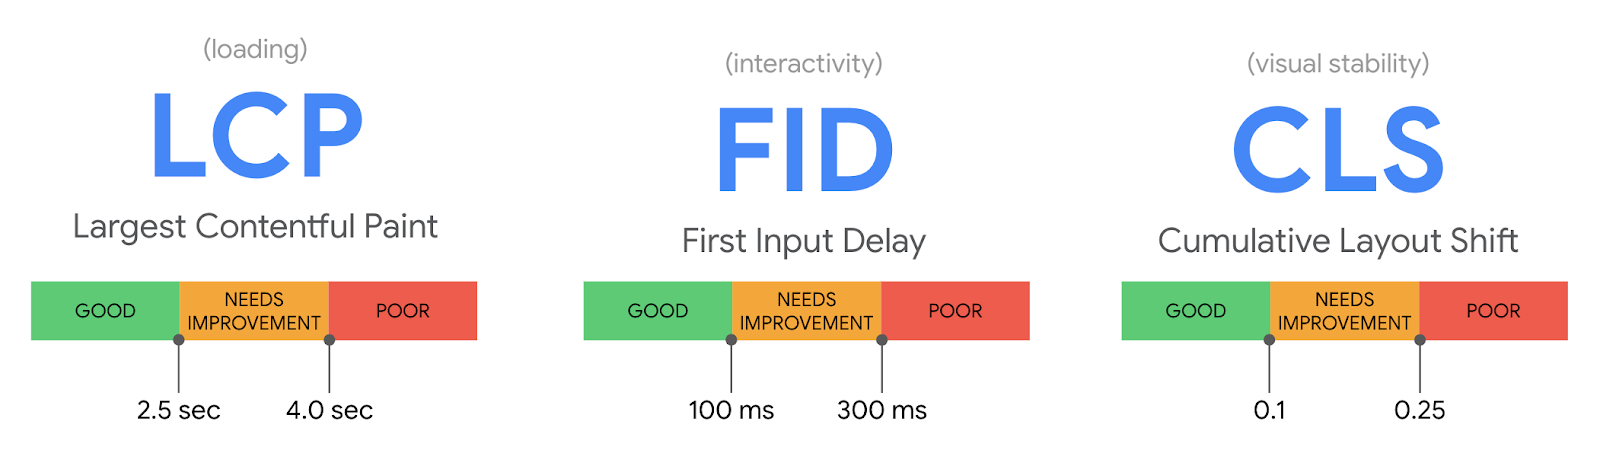
The three facets are:
- Loading: how fast is this page? Largest Contentful Paint measures perceived load speed and marks the point on the page load timeline when the page’s main content has likely loaded.
- Interactivity: how fast does the page react to user input? First Input Delay measures responsiveness and quantifies the experience users feel when trying to first interact with the page.
- Visual stability: does the page layout change while the page is loading? Cumulative Layout Shift measures visual stability and quantifies the amount of unexpected layout shift of visible page content.
All of Google's popular tools for developers support measurement of Core Web Vitals, including Lighthouse, PageSpeed Insights ↗︎, Chrome DevTools ↗︎, Search Console ↗︎, web.dev's measure tool, the Web Vitals Chrome extension ↗︎ and the new Chrome UX Report ↗︎ API.
It is important to mention that FID can't be measured in Lighthouse and as an alternative, Google recommends measuring the Total Blocking Time (TBT) ↗︎. Tools like Lighthouse that load pages in a simulated environment without a user can not measure FID, since a simulated environment has no user input.
Using Lighthouse for Core Web Vitals measurements
The Web Vitals information is very easily found in the Lighthouse reports:
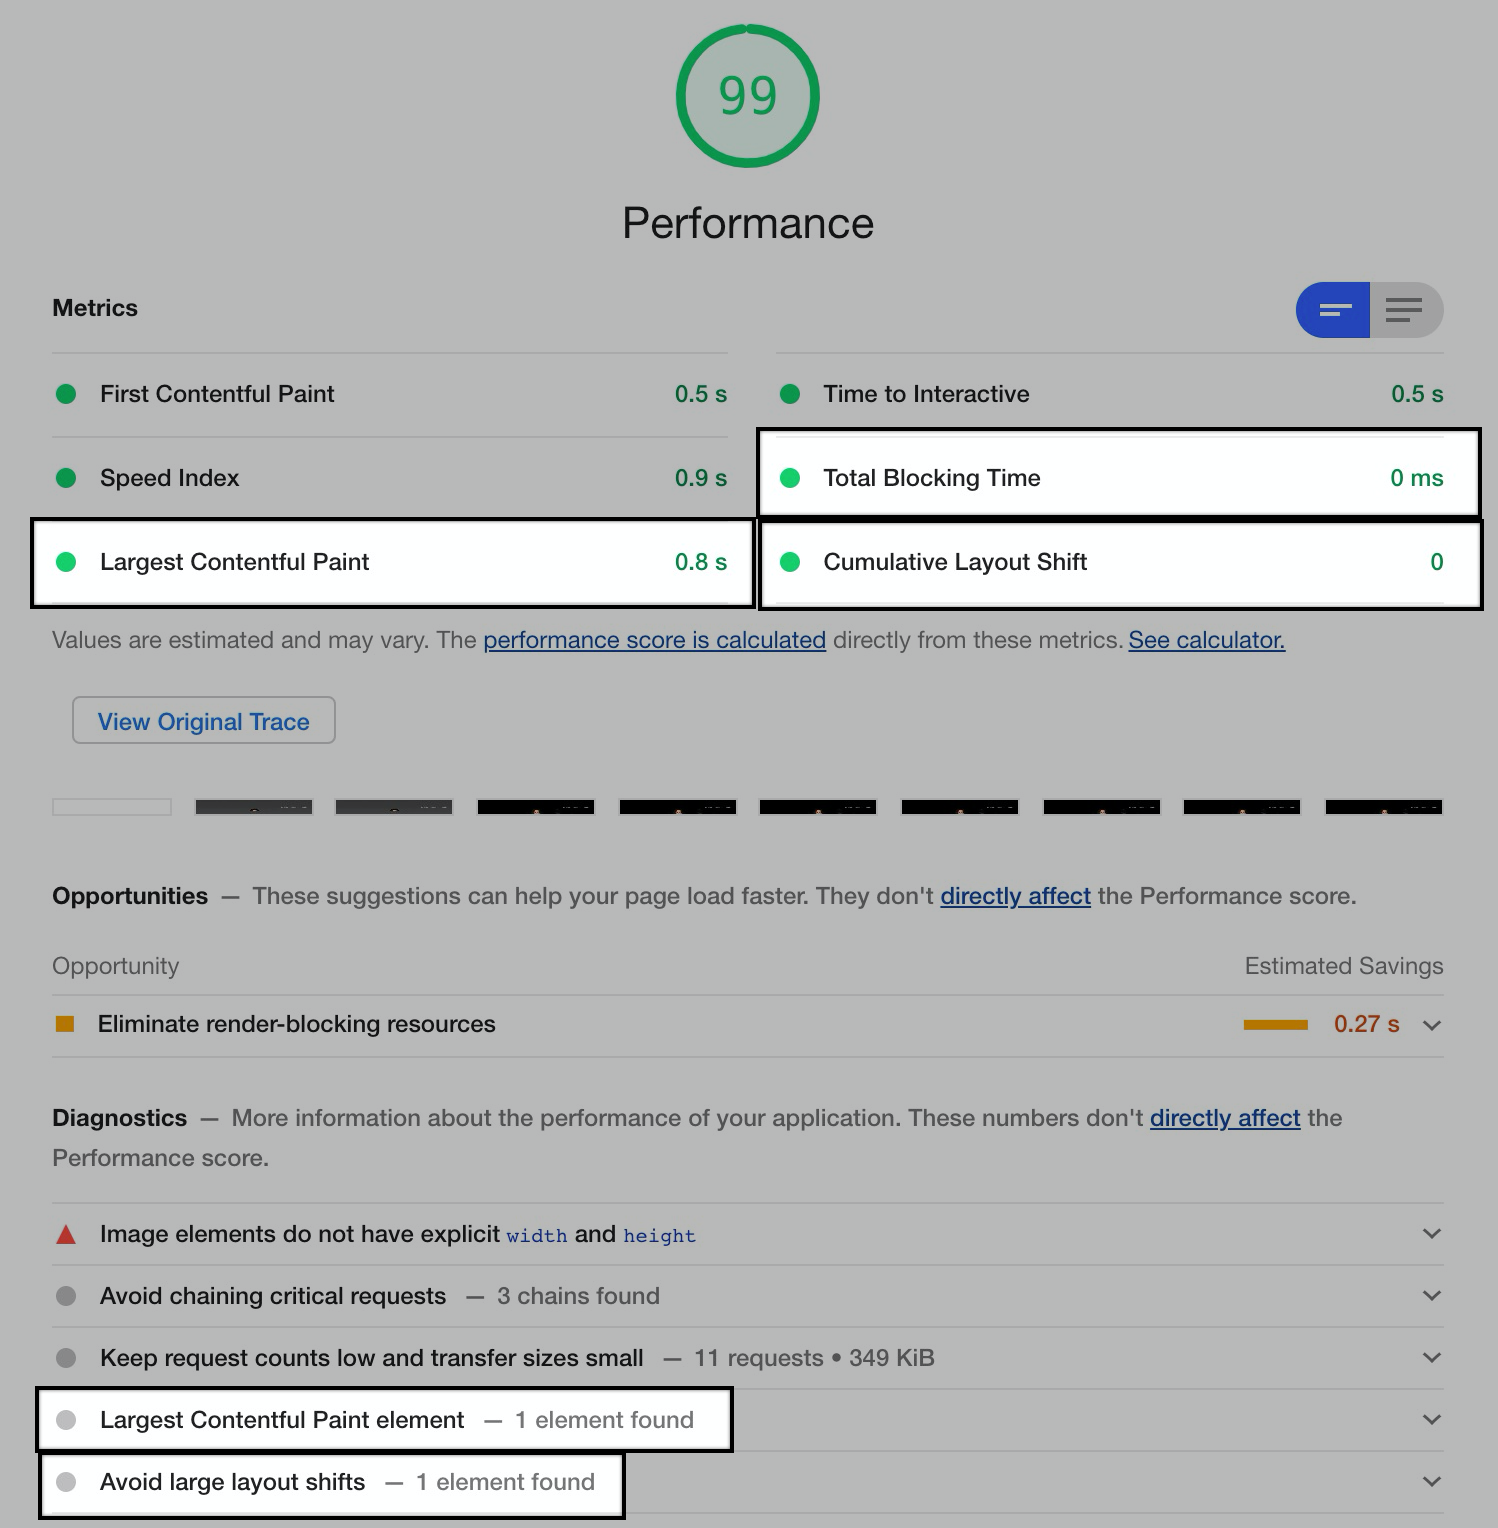
What I want to share today is how to get Web Vitals information from the Lighthouse node package (from my lighthouse-examples GitHub repository):
const lighthouse = require('lighthouse');
const chromeLauncher = require('chrome-launcher');

(async () => {
  const chrome = await chromeLauncher.launch({chromeFlags: ['--headless']});
  const options = {port: chrome.port, emulatedFormFactor: 'desktop'};
  const { lhr: { audits } } = await lighthouse('https://leonardofaria.net', options);

  const webVitals = {
    largestContentfulPaint: audits['largest-contentful-paint'].numericValue,
    cumulativeLayoutShift: audits['cumulative-layout-shift'].numericValue,
    totalBlockingTime: audits['total-blocking-time'].numericValue,
    largestContentfulPaintElement: audits['largest-contentful-paint-element'].details.items[0].node.snippet,
    layoutShiftElements: audits['layout-shift-elements'].details.items.map(({ node }) => node.snippet).toString(),
  };

  console.log(webVitals);

  await chrome.kill();
})();
The information highlighted in the image above can be found in lines 9 - 14. The output of the script:
{
  largestContentfulPaint: 3429.8639999999996,
  cumulativeLayoutShift: 0.0002832719606426758,
  totalBlockingTime: 0,
  largestContentfulPaintElement: '<header id="header" className="header flex w-full m-0 bg-cover bg-top-center" style="background-image: linear-gradient(rgba(0, 0, 0, 0.7), rgba(0, 0, 0, 0.55))…">',
  layoutShiftElements: '<div id="nav-menu" className="absolute lg:p-6 hidden lg:block self-end text-white rounded-md bg-black sh…">,<a href="https://leonardofaria.net/" className="tracking-tighter text-4xl font-semibold flex flex-shrink-0 text-center px-…">'
}
For LCP, CLS and TBT, the output is not including a numeric unit, only the value. The goal here is to get a numeric value so we can manipulate data; for example, sorting or finding minimum / maximum values. If data manipulation is not the main goal, using the displayValue property instead of numericValue may work better. Example:
{
  largestContentfulPaint: '2.4 s',
  cumulativeLayoutShift: '0',
  totalBlockingTime: '30 ms',
}
The two last properties of the webVitals object return strings containing HTML node. The intention of reporting these elements is to facilitate the identification of the villains of the page being tested.
Bad Largest Contentful Paint metric can be caused for one or more of the following:
- Slow server response times;
- Render-blocking JavaScript and CSS;
- Slow resource load times;
- Client-side rendering.
In the example, the largest contentful paint element is a header with a hero image. This element contains an external background image and the image is the culprit causing the slow rendering? time.
Bad Cumulative Layout Shift metrics can be caused for one or more of the following:
- Images without dimensions;
- Ads, embeds, iframes without dimensions;
- Dynamically injected content;
- Web fonts causing FOIT/Fout.
The page used in the example uses Google Fonts and there is a tiny layout shift when the font is loaded. The shift may be noticeable by users and it is reported in the layout shift elements property.
Why do we need this?
This script is useful in order to closely follow what is changing in the web vitals metrics of a page. In my case, I store the LCP, TBT and CLS numeric values in a database and use this information in a Gauge dashboard. I am not tracking the largest contentful paint element or layout shift elements yet.
Can you think of different use cases? Let me know in the comments!