Building Emergenetics Explorer
Last year I built a tool to visualize data from Emergenetics Profile. In this post, you will learn what is Emergenetics, why and how I built Emergenetics Explorer ↗︎, a data visualization tool in my spare time.
TL, DR: See the application live at https://emergenetics-explorer.leonardofaria.net and keep reading the post for details. The post is good, I promise.
Disclaimer: I am not affiliated with Emergenetics. I am genuinely curious about psychology and how we interact with each other, at work and outside work.
What is Emergenetics
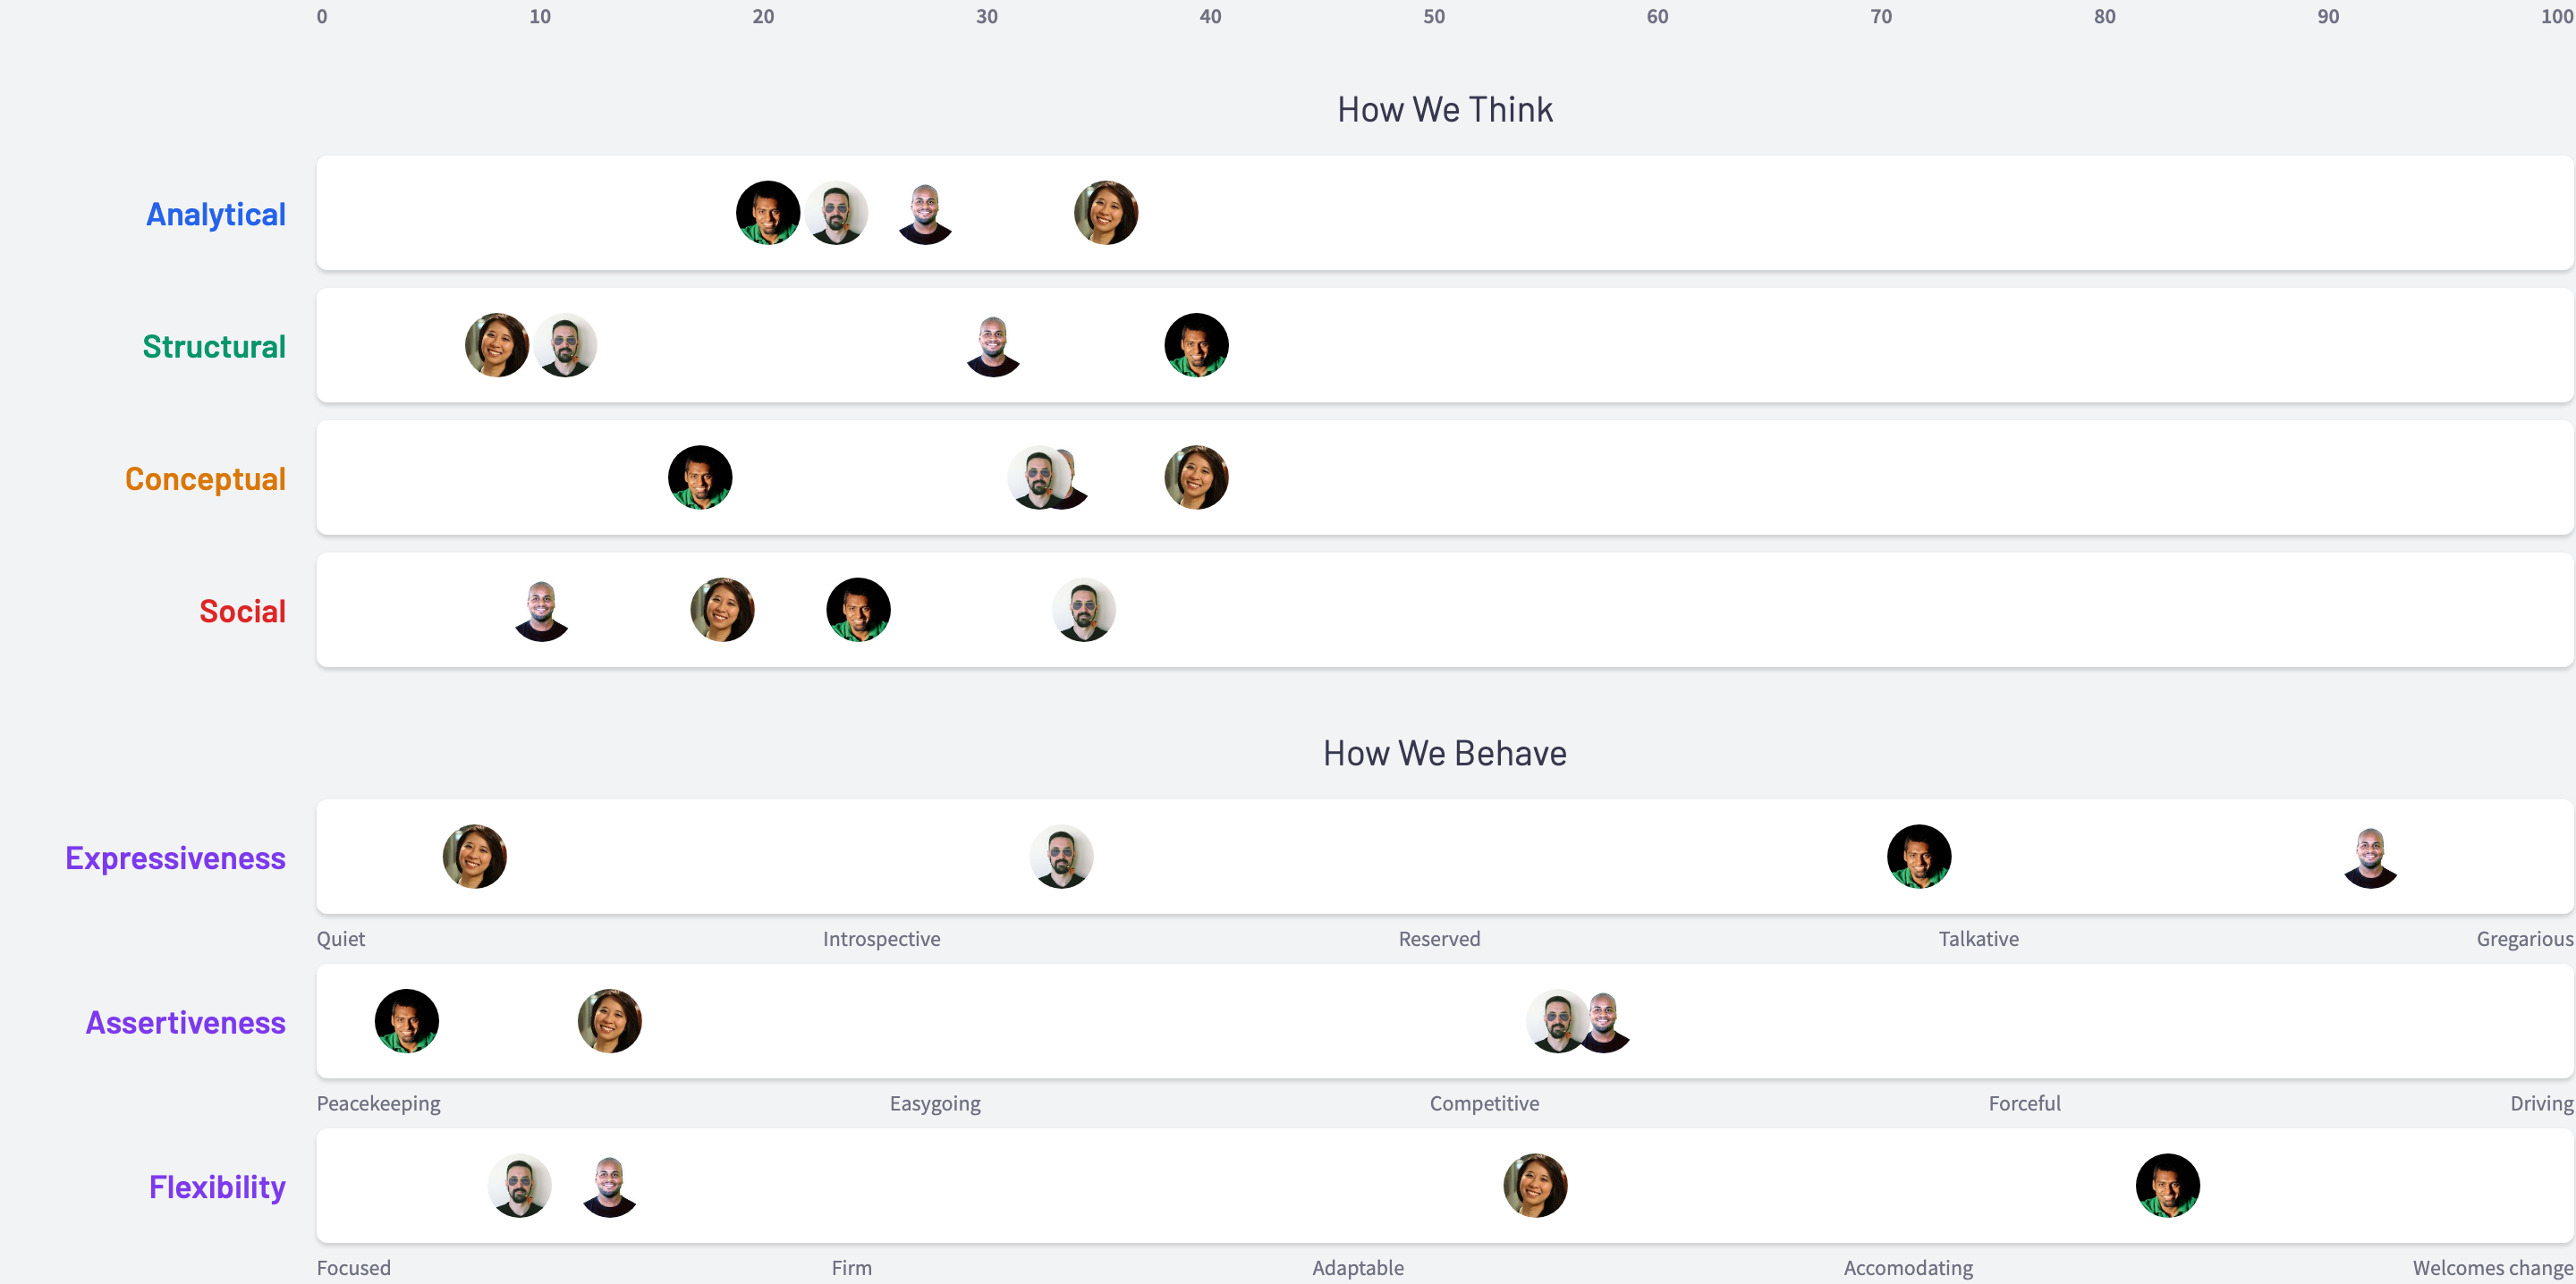
My previous company uses Emergenetics assessments as a way to learn how to work better. According to Wikipedia ↗︎, Emergenetics International uses psychometric research and behavioral studies to advise and consult with businesses and individuals on how to assess human capital. Their Emergenetics Profile is an assessment test to designate individuals by four thinking attributes, analytical, structural, social and conceptual, and three behavioral attributes, expressiveness, assertiveness and flexibility.
An Emergenetics Profile looks like this (full width):
From what I understand (from an analytical/structural brain), there is no right or wrong profile. People are different and as more diverse they are, the better. With the information of the profile, you can understand better your signs of brilliance, challenges and how you prefer others to communicate with you.
Idea
Since Emergenetics is very present in the company's culture, people started building charts showing where their team members fit in the analytical, structural, social and conceptual spectrums. Something like this:
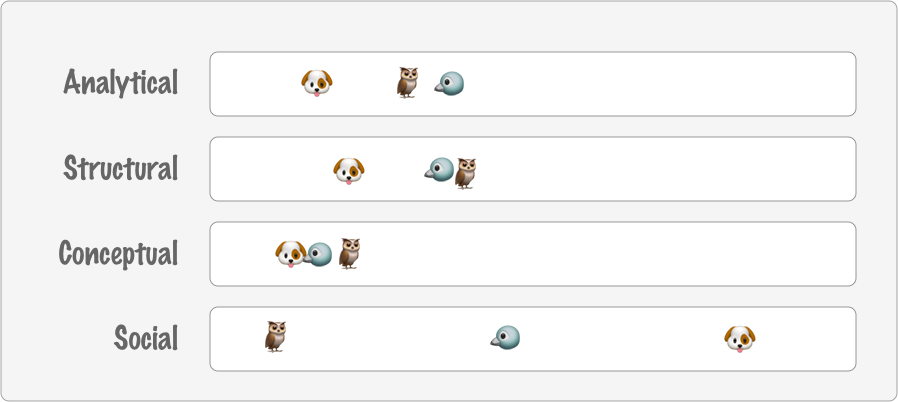
After seeing the second manually-made chart I decided to create my dynamically-made Emergenetics chart. After talking to a few people to get the data (the company doesn't have an API), I started coding.
Execution
My initial idea was to list all people's profiles and then the user could select the profiles of their interest. People should be able to see all profiles of a specific manager and have an option to download the chart for future use (team introductions for example).
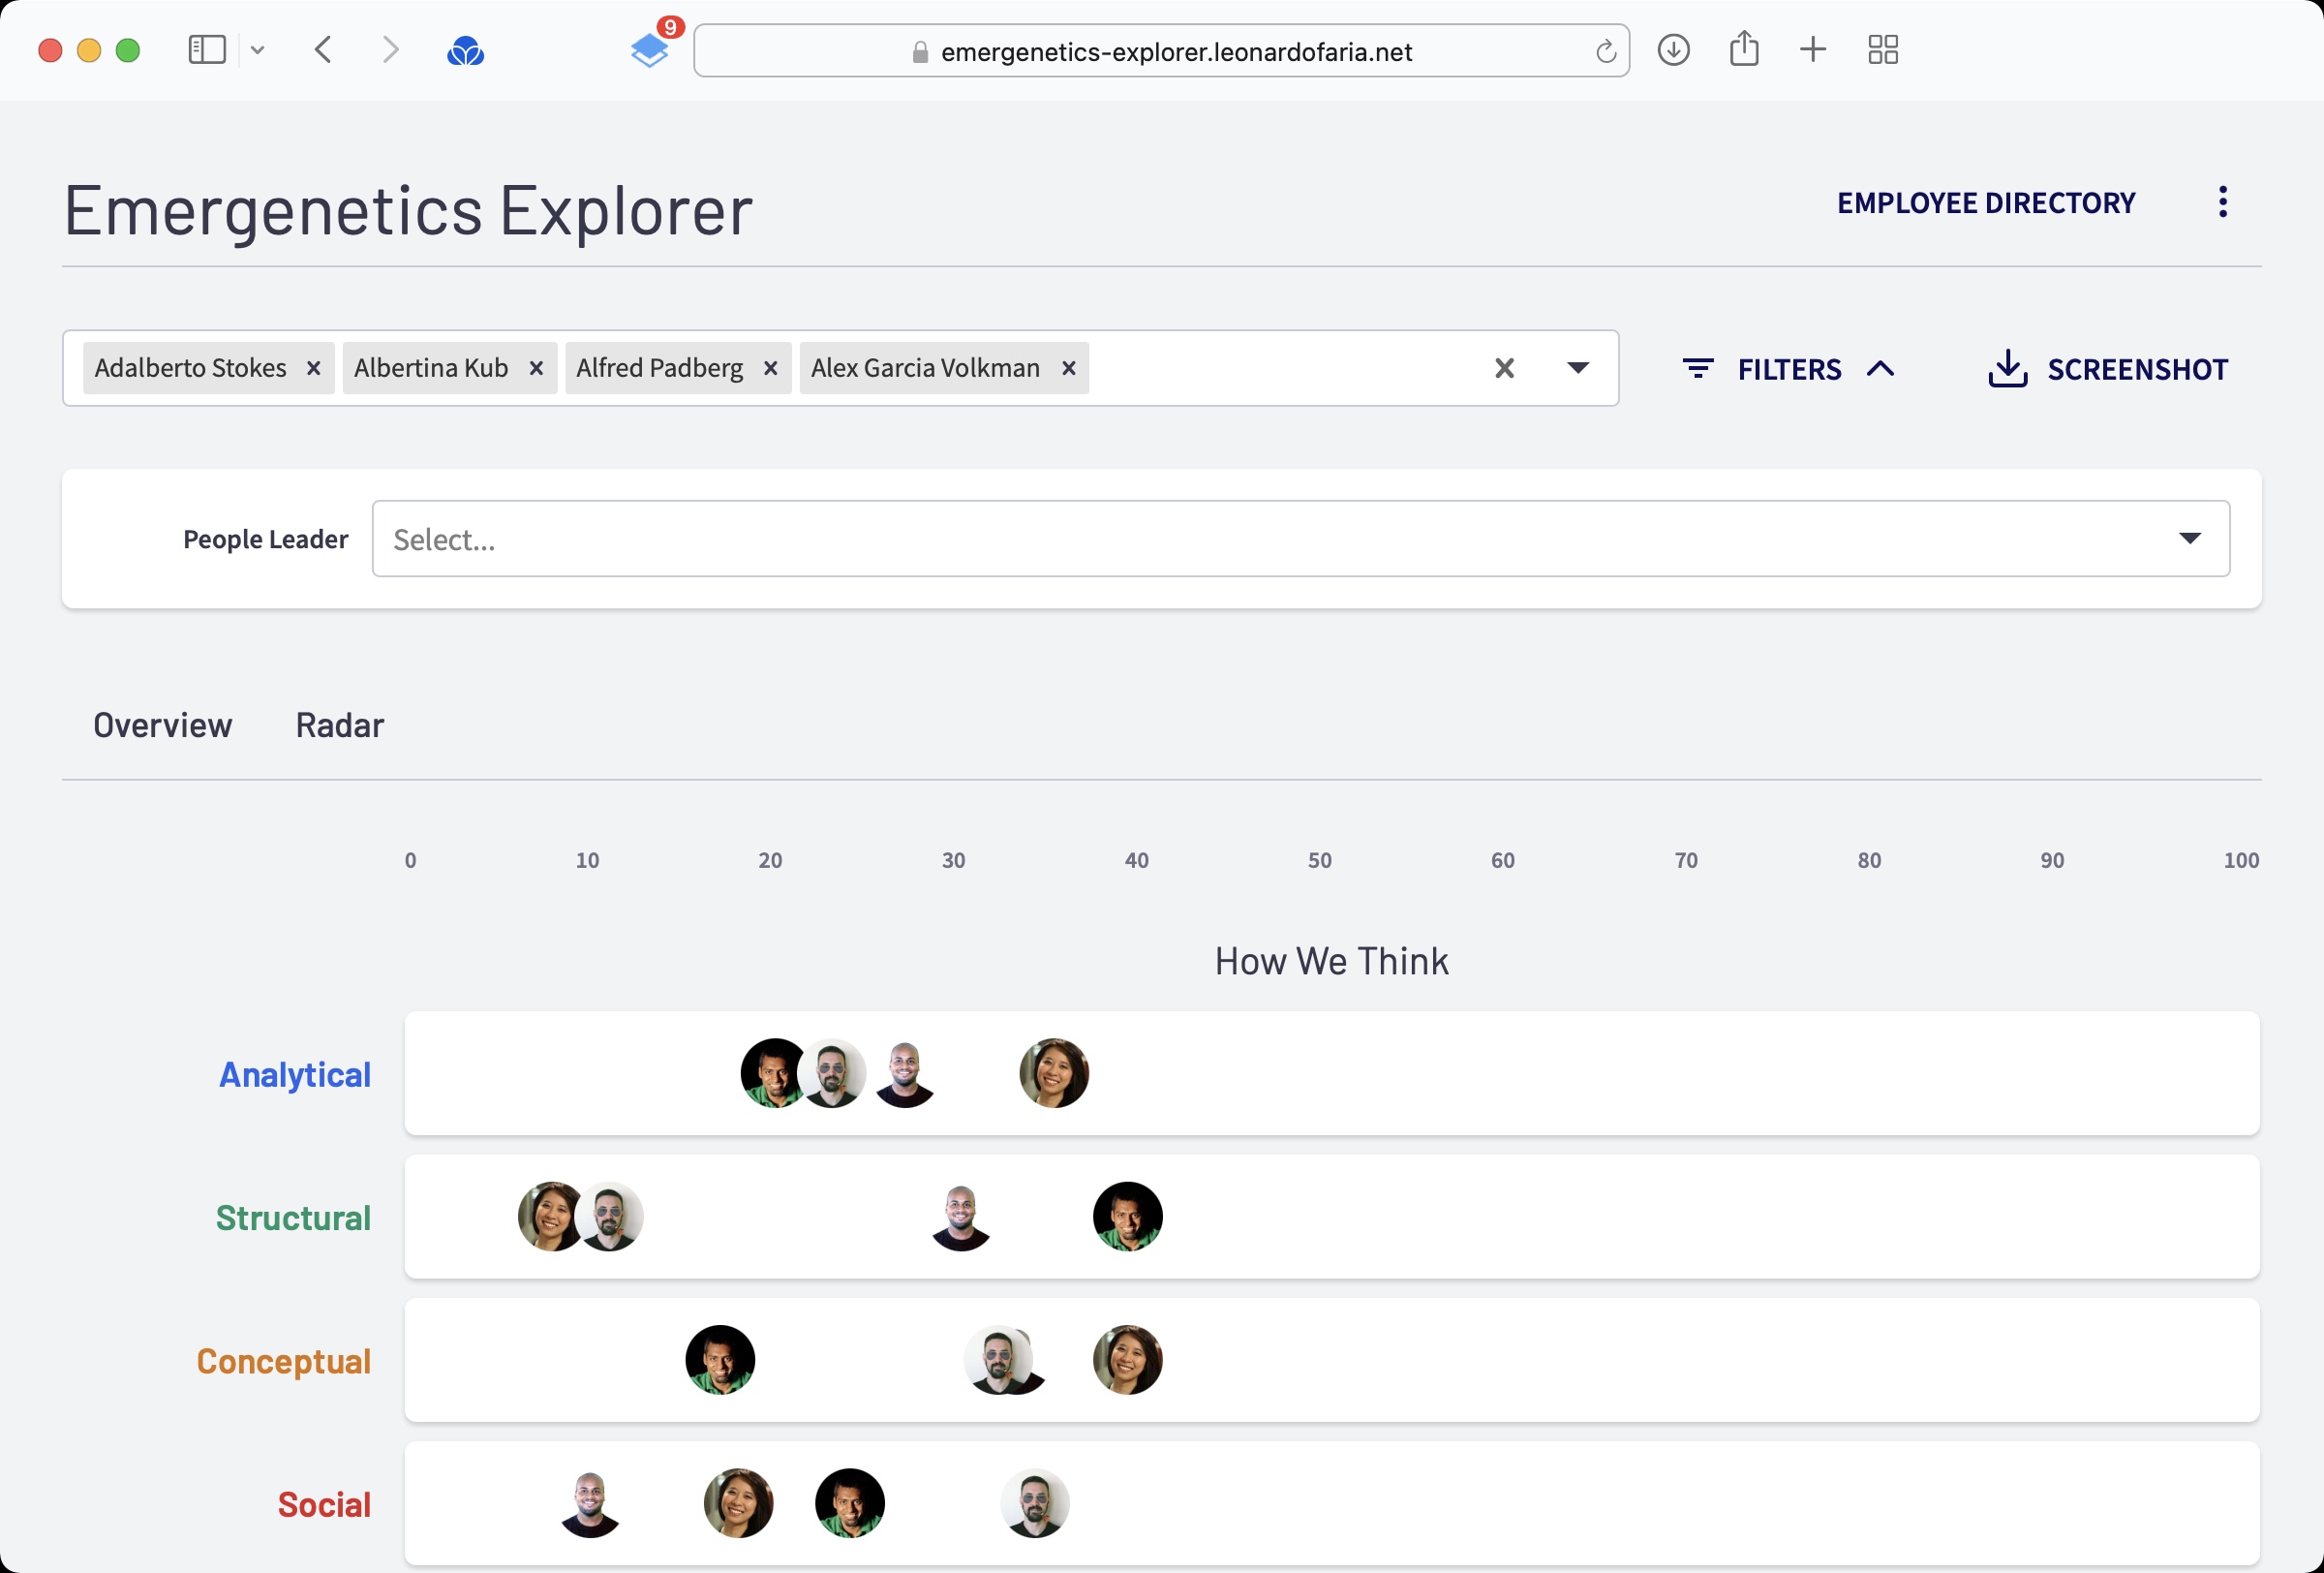
The data came from a CSV file, updated once a month after more employees took the Emergenetics assessment. I persisted the results in a database synced with BambooHR data. Using the BambooHR API here was very important because I could present the employee Emergenetics results along with their other data (profile photo and manager).
The non-Emergenetics portion of the Emergenetics Explorer
After I finished this MVP version of the application, I thought it would be cool to add new features to the "product". The first of them was a Directory page ↗︎.
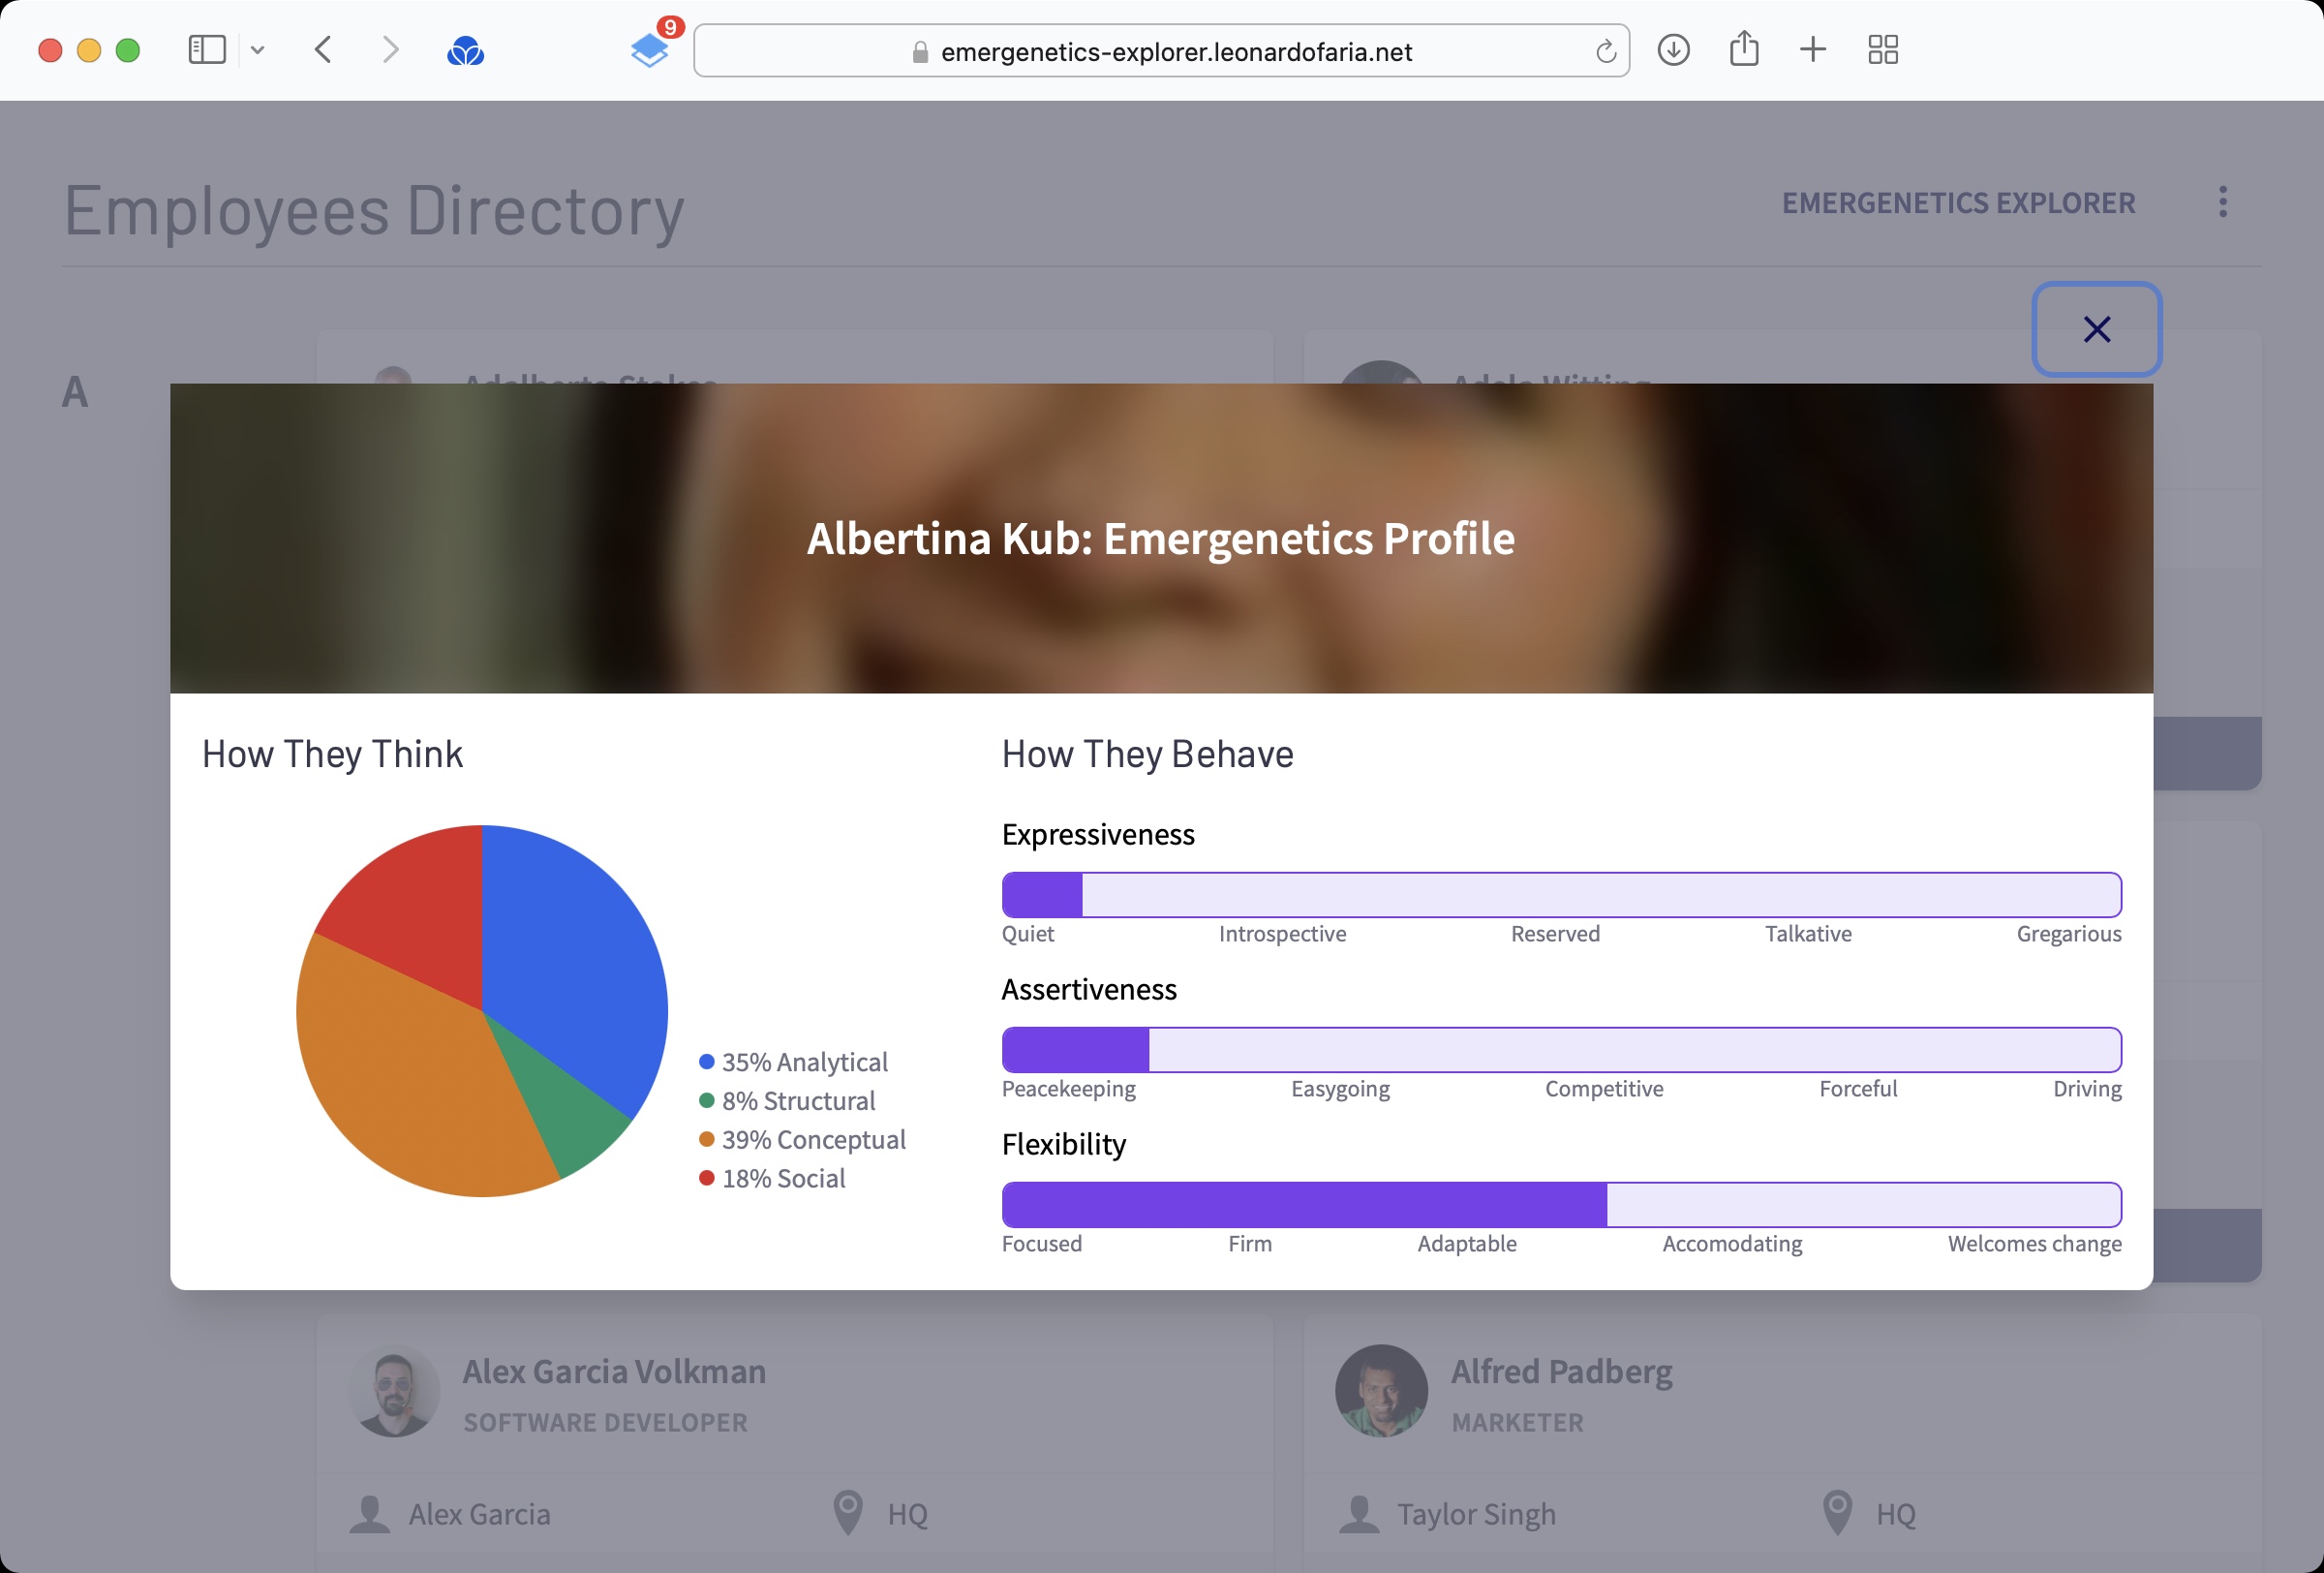
The Directory page lists all employees and their basic info (title, division, department, location, manager). You can also check their individual Emergenetics profiles.
Map
Since I also had the name of the city, state and country of employees, I thought it would be cool to show where employees live in a map ↗︎. Since the company became remote-first, people liked this a lot to get to know where their colleagues live.
Radar
A designer created a radar version of the Emergenetics data in Figma (I have no idea how) and I added similar visualization in the application.
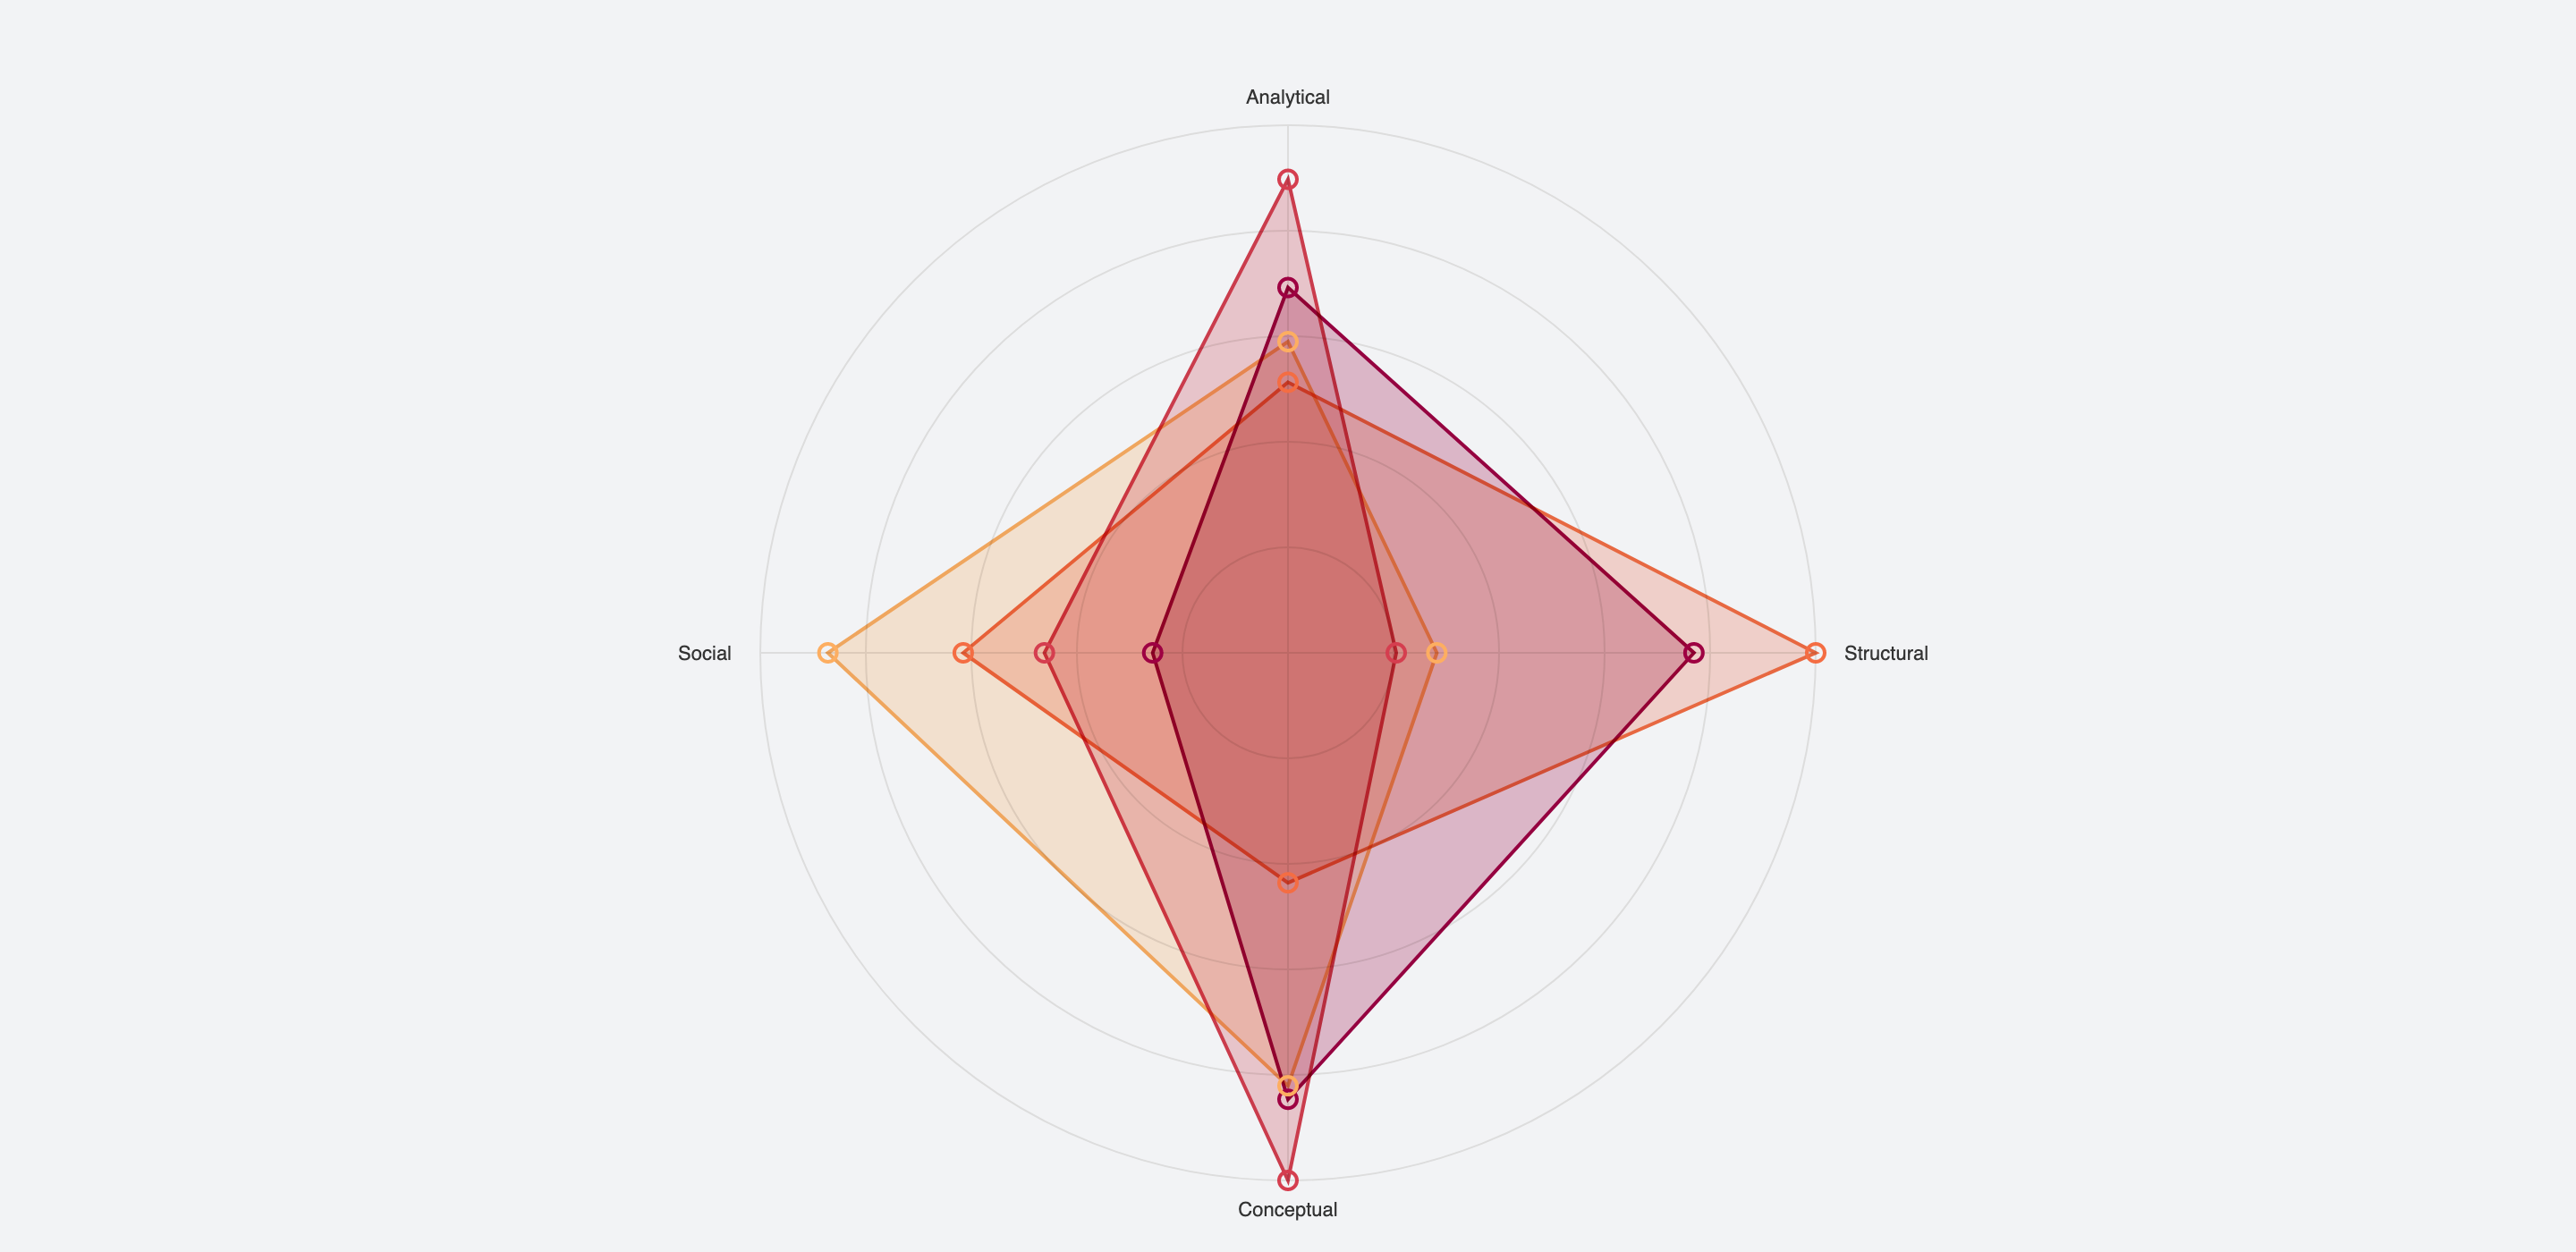
This radar chart was quite interesting to see with live data: it showed how people with specific job titles had similar profiles (too social or too analytical).
Technical details
This project was also a good excuse to work with tech that I was not working with at my job. Generally speaking, it is a Next.js TypeScript project deployed to Vercel. To make this project reality, I wrote a small API parser in Ruby and played with Google Maps and data visualization tools. I also implemented UI elements (buttons, modals, etc) with the same company's look and feel in Tailwind CSS.
Live
You can see the application live at https://emergenetics-explorer.leonardofaria.net. This environment uses sample data created with Faker. To see the data, you need to authenticate with any Google account (in the real environment, only users of a specific domain can see the real data).
